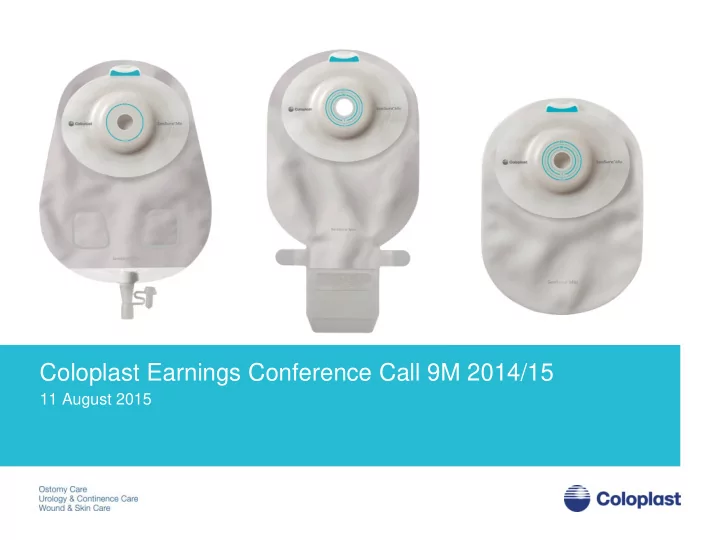

Coloplast Earnings Conference Call 9M 2014/15 11 August 2015
Forward-looking statements The forward-looking statements contained in this presentation, including forecasts of sales and earnings performance, are not guarantees of future results and are subject to risks, uncertainties and assumptions that are difficult to predict. The forward-looking statements are based on Coloplast’s current expectations, estimates and assumptions and based on the information available to Coloplast at this time. Heavy fluctuations in the exchange rates of important currencies, significant changes in the healthcare sector or major changes in the world economy may impact Coloplast's possibilities of achieving the long-term objectives set as well as for fulfilling expectations and may affect the company’s financial outcomes. Page 2
9M 14/15 organic growth of 7% and 32% EBIT margin Highlights Performance Revenue (mDKK) Organic revenue growth of 7% (12% in DKK) Organic growth (%) Gross margin of 68% on par with last year 25.000 24.000 23.000 9 22.000 21.000 9 7 20.000 19.000 18.000 EBIT margin of 32%, both in DKK and fixed 17.000 16.000 15.000 10.288 14.000 4 9.214 13.000 12.000 11.000 10.000 currencies (33% last year) 9.000 8.000 7.000 -1 6.000 5.000 4.000 3.000 2.000 1.000 ROIC after tax before special items of 46% 0 -6 9M 2013/14 9M 2014/15 Unchanged financial guidance for FY 2014/15: EBIT (mDKK) − Organic revenue growth of ~7% (~12% in 9.000 60 DKK) EBIT margin (%) 8.000 7.000 * 40 33 − 32 6.000 EBIT margin ~32% (constant exchange 5.000 * 20 3.286 rates and DKK) 4.000 3.047 3.000 0 2.000 1.000 0 -20 9M 2013/14 9M 2014/15 * Before special items. Special items Q2 2013/14 includes DKK 1,000m provision Page 3
9M 14/15 organic growth was 7% against a market growth of ~5% 9M 14/15 revenue by business area 9M 14/15 revenue by geography Reported revenue Organic growth Reported revenue Organic growth Business Geographic mDKK In percent mDKK In percent area area European Ostomy 6% 4,118 5% 6,581 markets Care Continence 7% Other 3,689 Care developed 5% 2,151 markets Urology 5% 1,017 Care Emerging 20% 1,556 markets Wound & 9% 1,464 Skin Care Coloplast Coloplast Group 7% 7% 10,288 10,288 Group Page 4
Q3 14/15 operating margin impacted by non-recurring costs Highlights Q3 2014/15 Performance drivers Q3 2014/15 Q3 14/15 gross margin came in at 68% 33.5% EBIT Margin Q3 2013/14 including write-down of NPWT inventory Distribution-to-sales ratio of 28.0% in line ∆ Gross profit margin with last year Admin-to-sales ratio of 5.9% including ∆ Distribution -to-sales provisions for Department of Justice investigation and increased bad debt in ∆ Admin -to-sales Southern Europe ∆ R&D -to-sales R&D-to-sales 3.2% on par with last year Free cash flow for 9M 2014/15 was DKK ∆ Other operating items 1,950m compared to DKK 1,611m for the same period last year EBIT Margin Q3 2014/15 30.3% Page 5
Unchanged financial guidance for 2014/15 Guidance Guidance Long term ambition 14/15 14/15 (DKK) Sales growth ~7% (organic) ~12% 7-10% p.a. ~32% (fixed) ~32% +50-100 bps p.a. EBIT margin CAPEX (DKKm) ~650 ~4-5% of sales Tax rate ~24% - Page 6
Our mission Making life easier for people with intimate healthcare needs Our values Closeness… to better understand Passion… to make a difference Respect and responsibility… to guide us Our vision Setting the global standard for listening and responding Page 7
Recommend
More recommend