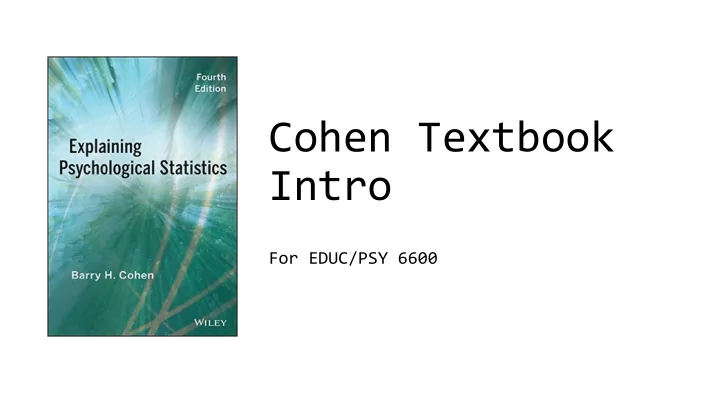

Cohen Textbook Intro For EDUC/PSY 6600
“A-B-C” format Section C Section A Section B • • • Basic statistical How to use SPSS Simplest case of the to perform the procedure procedure procedures • • More general cases with Explain definitional • formulas (for real data Little known • insight) syntax ‘tricks’ Computational formulas • • • Emphasis is Significance tests SPSS data • underlying similarity management tools Comments on research of formulas that may • design How to read SPSS look very different • Supplementary output procedures • • All exercises Detailed summary • How to report in APA based on the Ihno • Exercises Dataset style • Detailed summary • Exercises
Unit Unit Title Chap # Chapter Titles Intro to Psychological Statistics 0 Basic Introduction 1 APA Style & Journal Articles SPSS Basics & Data Manipulation 2 Exploration Data with Plots 1 Exploratory Data Analysis 3 Summarizing Data with Descriptive Statistics 4 Standardized Scores & The Normal Distribution 5 Intro to Hypothesis Testing: 1 Sample z-test 6 Confidence Interval Estimation: The t Distribution 2 Groundwork for Inference 7 2 Independent Samples t-test for Means 8 Statistical Power & Effect Size 9 Linear Correlation Hypothesis Tests for 3 10 Linear Regression 2 Measures per Subject 11 Matched t Test 12 1-Way ANOVA ANOVA 4 13 Multiple Comparisons w/o repeated measures 14 2-Way ANOVA ANOVA 15 Repeated-Measures ANOVA 5 with repeated measures 16 2-Way Mixed-Design ANOVA 19 The Binomial Distribution 6 Categorical Data Analysis 20 Chi-Squared Test for Independence & Goodness of Fit
Appendixes Appendix A Appendix B Appendix C • Statistical • Answers • Ihno’s dataset tables • to selected • The electronic • “ z ” standard exercises (*) from ‘excel’ version normal sections A & B is on CANVAS • “ t ” student’s t • Do NOT waste time • “ X 2 ” chi squared typing it into the computer!!! • Etc.
Ihno’s (Eee-know) experiment • Ihno was an advanced PhD student, TA several stats sections • 100 participants enrolled in those sections & voluntarily consented to participate (IRB) • Data collected on FIRST day of class • Background questionnaire: contact info, gender, major, why enrolled, coffee drinking habit, # math classes completed • Required math placement/diagnostic quiz score (prior to registering) • Self rating of math phobia (0-10) • Some registered late à some data missing … how do you deal with that ? • Data collected a week before the experiment • Regular 10-question quiz score
Ihno’s (Eee-know) experiment • Start of class: PRE-quiz: • Taught students how to take their own pulse & took two baseline measures (bpm) • Self-report: # cups of coffee since waking up that day • Self-report: Anxiety questionnaire w/10 items, each rated 0-4 (5-point Likert scale), total scores 0-40 (baseline anxiety) • ANNOUNCEMENT: “POP QUIZ” w/11 multiple choice (10 questions, 1pt each + 11 th question = 3 points extra • credit) The 11 th question varied (25 each: easy, moderate, difficult, or impossible to • solve) • End of class: POST-quiz • After collecting quiz, REPEATED the pulse and anxiety collection Ihno explained the quiz would be graded (not 11 th question) and returned, but would • NOT count towards their grade
Recommend
More recommend