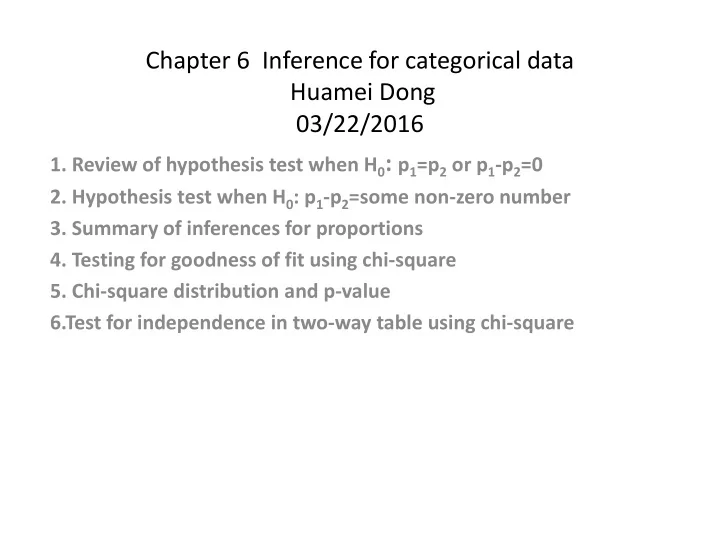

Chapter 6 Inference for categorical data Huamei Dong 03/22/2016 1. Review of hypothesis test when H 0 : p 1 =p 2 or p 1 -p 2 =0 2. Hypothesis test when H 0 : p 1 -p 2 =some non-zero number 3. Summary of inferences for proportions 4. Testing for goodness of fit using chi-square 5. Chi-square distribution and p-value 6.Test for independence in two-way table using chi-square
1. Review of hypothesis test for H 0 : p 1 -p 2 =0 or p 1 =p 2 We have learned the hypothesis test for H 0 : p 1 -p 2 =0 or p 1 =p 2 . In the test, we use to calculate the standard error In this test, we assume H 0 is true and try to find p-value. If H 0 is true, the two population proportions are equal and we should use one sample proportion, the pooled proportion estimate, to calculate standard error.
2. Hypothesis test for H 0 : p 1 -p 2 =c (some constant not equal to 0) When we test for H 0 : p 1 -p 2 =some non-zero number, we still use and to estimate the standard error Example 1 There were 50 patients in the experiment who did not receive the blood thinner and 40 patients who did. Survived Died Total control 11 39 50 treatment 14 26 40 total 25 65 90 Does this provide convincing evidence for the claim that blood thinners improve survival rate more than 8% using significant level 0f 0.05?
Answer: (1) H 0 : p t -p c =0.08, H A : p t -p c >0.08 (2) Check the success-failure condition: Using (3) Point estimate for p t -p c is (4) Standard error is (5) Now we calculate Z score and find the p-value.
The Z score is 0.5236 The right tail area is 0.3 (6) Since p-value is 0.3 which is big than 0.05, we don’t reject H 0. That is we don’t have convincing evidence for improvement of 8% survival rate. 3. Summary of inferences for proportions
: Point estimate for p 1, : Point estimate for p 2 95% confidence interval for p 1 Hypothesis test for H 0 : p 1 =0.5 Using to calculate z score and p-value Point estimate for p 1 -p 2 95% confidence interval for p 1 -p 2 : Here Z*=1.96 Hypothesis test for H 0 : p 1 -p 2 =0.2 using and to get p-value Hypothesis test for H 0 : p 1 -p 2 =0 or p 1 =p 2 using Here is pooled proportion estimate.
4. Testing for goodness of fit using chi-square Given a sample of cases that can be classified into several groups, how can we test if the sample is representative of the general population? Example 2 We consider data from a random sample of 275 jurors in a small county as in the following table. We would like to determine if these jurors are racially representative of the population. How should we do the test? The idea is that if the jury is representative of the population, then the proportion in the sample should roughly reflect the population of registered voters. Let’s check the following table. If the more the differences between the observed data and expected data are, the stronger evidence we have for not fit.
5. Chi-square distribution and p-value Three chi-square distributions with different degrees of freedom Chi-square distribution with 3 degree Chi-square distribution with 2 degree of freedom, area above 6.25 shaded of freedom, area above 4.3 shaded
Example 2 We consider data from a random sample of 275 jurors in a small county as in the following table. We would like to test at 5% significant level if these jurors are racially representative of the population. Answer: (1) H 0 : The jury is representative of the population. H A : The jury is not representative of the population. (2) Calculate X 2 : (3)Using R or table to find the p-value, which is the right tail area for Chi-square. Using R: “ pchisq(5.89, 3)” we get 0.8828, so the right tail is 0.1172>0.05. We don’t reject H 0 .
6.Test for independence in two-way table using chi-square Test of two-way table is very similar to the test of one-way table. We still use chi-square test. There are two modifications here. (1) Calculation of the expected count: (2)
Example 3 The following table are the results of a Pew Research Poll. We would like to test if there are actually differences in the approval rating of Barack Obama, Democrats in Congress, and Republicans in Congress. Answer: (1) H 0 : There is no difference in approval rating between three groups. H A : There is some difference in approval rating between three groups. (2) Obama Democrats Republican Total Approval 842 736 541 2119 (E=2119x1458/4223 (E=2119x1382/4223 (E=2119x1383/4223 =731.6) =693.45) =693.96) Disapprove 616 646 842 2104 (E=2104x1458/4223 (E=2104x1382/4223 (E=2104x1383/4223 =726.4) =688.55) =689.04) total 1458 1382 1383 4223
For first cell, we calculate (842-731.6) 2 /731.6=16.7. Similarly we calculate all the cells, and add all the results together. Then we have X 2 =16.7+…..+34.0=106.4 Degree of freedom=(2-1)(3-1)=2. Using R: pchisq(106.4, 2)=1. So the right tail area is 0<0.05. We reject H 0 .
Homework on 03/22/16 (due 03/29/16) (1) Try to finish the following table and do one-way chi-square test. I have 33.3% (or 1/3) black dice, 40% (or 2/5) white dice, and 26.7 % (or 4/15) color dice. Try to sample 60 dice in total and finish one way test. black white color total 33.3% 40% 26.7% 1.00 (2) Using the data you and all your classmates collected on 03/15/16 to do the two-way table chi-square test. Yours Classmate 1 Classmate 2 Classmates 3 total Black White total
Recommend
More recommend