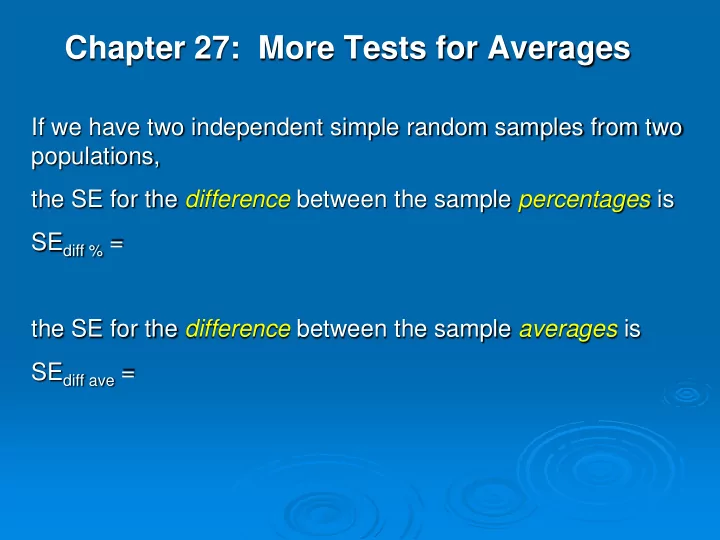

Chapter 27: More Tests for Averages If we have two independent simple random samples from two populations, the SE for the difference between the sample percentages is SE diff % = the SE for the difference between the sample averages is SE diff ave =
Example 1. Box A has an average of 65 and an SD of 10. Box B has an average of 69 and an SD of 12. We take a simple random sample of 300 from box A and an independent simple random sample of 500 from box B. a) We expect the sample average from box B to be _______ larger than the sample average from box A. b) The standard error for the difference in part a) is ___. c) We expect the difference between the average from box B and the average from box A to be between ___ and ___ 95% of the time.
Example 2. County A has 45% Republicans and County B has 47% Republicans. We take a simple random sample of 300 from County A and an independent simple random sample of 500 from County B. a)We expect the percentage of Republicans from County B to be _______% larger than that from County A. a)The standard error for the difference in part a) is ___%. b) We expect the difference between the % from box B and the % from box A to be between ___ and ___ 95% of the time.
The two-sample z test (percentages) If we have two independent simple random samples from two populations, we can test Null : the percentage of 1s in population A = the percentage of 1s in population B Alt : the percentage of 1s in population A is (less than/more than/not the same as) the percentage of 1s in population B Using z = observed % for pop. A - observed % for pop. B SE diff %
The two-sample z test (averages) If we have two independent simple random samples from two populations, we can test Null : the average for pop. A = the average for pop. B Alt : the average for pop. A is (less than/more than/not the same as) the average for pop. B Using z = observed ave for pop. A - observed ave for pop. B SE diff ave
Example 3. A billboard company takes a simple random sample of 500 Salt Lake residents and finds that only 26 know that Calvin Coolidge was the 30th President. They then put up several yellow billboards that say “Calvin Coolidge was the 30th President”. After a few weeks, they take an independent simple random sample of 500 residents, and 158 answer correctly. Is this evidence that people see the billboards?
The two-sample z-test assumes that the two samples are independent. The samples should be large enough that the difference will follow the normal curve. The two-sample z-tests can also be used for randomized, controlled, double-blind experiments!
Example 4. A class of 499 students are randomly assigned to 2 groups. 250 eat Wheaties, 249 Sugar Pops. For the final exam scores, we get Wheaties: average= 66 SD=21 Sugar Pops: average= 59 SD=20 Is there evidence that students do better on Wheaties?
Example 5. 1970’s randomized, controlled, double-blind experiment to test the effectiveness of “cholestyramine”. 3906 subjects- 1906 treatment - 155 heart attacks 1900 control - 187 heart attacks Test to see whether cholestyramine prevents heart attacks. Test again, but this time assume that before the study was done they did not know for sure whether cholestyramine would increase or decrease risk of heart attack.
Example 6. A math professor wants to know whether big classes or small classes work better. He teaches a small class in Fall quarter (40 students), and a large class in Spring quarter (120 students). Final exams show: Fall: average = 76 SD = 15 Spring: average = 74 SD = 14 Can he test the hypothesis that small classes are better?
Example 7. To decide whether the average GPA of male USU students is equal to the average GPA of female USU students, a researcher finds the average and SD of GPA of all female USU students and all male USU students. If we had these numbers, could we perform a hypothesis test to decide whether the average GPA of male USU students is equal to the average GPA of female USU students? If not, what could we do?
Recommend
More recommend