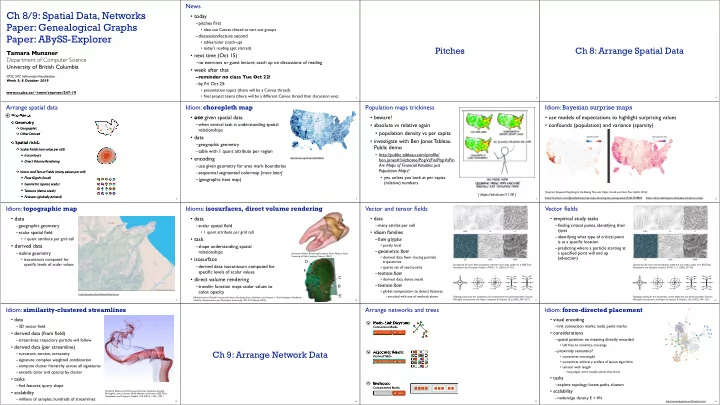

News Ch 8/9: Spatial Data, Networks • today –pitches first Paper: Genealogical Graphs • idea: use Canvas thread to sort out groups Paper: ABySS-Explorer –discussion/lecture second • tables/color (catch-up) Pitches Ch 8: Arrange Spatial Data • today's reading (get started) Tamara Munzner • next time (Oct 15) Department of Computer Science –no exercises or guest lecture, catch up on discussions of reading University of British Columbia • week after that CPSC 547, Information Visualization –reminder no class Tue Oct 22! Week 5: 8 October 2019 –by Fri Oct 25: • presentation topics (there will be a Canvas thread) www.cs.ubc.ca/~tmm/courses/547-19 • final project teams (there will be a different Canvas thread than discussion one) 2 3 4 Idiom: choropleth map Idiom: Bayesian surprise maps Arrange spatial data Population maps trickiness Use Given • use given spatial data • beware! • use models of expectations to highlight surprising values Geometry –when central task is understanding spatial • absolute vs relative again • confounds (population) and variance (sparsity) Geographic relationships • population density vs per capita Other Derived • data • investigate with Ben Jones Tableau Spatial Fields –geographic geometry Public demo Scalar Fields (one value per cell) –table with 1 quant attribute per region • http://public.tableau.com/profile/ Isocontours • encoding http://bl.ocks.org/mbostock/4060606 ben.jones#!/vizhome/PopVsFin/PopVsFin Direct Volume Rendering Are Maps of Financial Variables just –use given geometry for area mark boundaries Population Maps? Vector and Tensor Fields (many values per cell) –sequential segmented colormap [more later] • yes, unless you look at per capita Flow Glyphs (local) –(geographic heat map) (relative) numbers Geometric (sparse seeds) Textures (dense seeds) [Surprise! Bayesian Weighting for De-Biasing Thematic Maps. Correll and Heer. Proc InfoVis 2016] [ https://xkcd.com/1138 ] Features (globally derived) https://medium.com/@uwdata/surprise-maps-showing-the-unexpected-e92b67398865 https://idl.cs.washington.edu/papers/surprise-maps/ 5 6 7 8 Idiom: topographic map Idioms: isosurfaces, direct volume rendering Vector and tensor fields Vector fields • data • data • data – • empirical study tasks –many attribs per cell –finding critical points, identifying their –geographic geometry –scalar spatial field types • idiom families –scalar spatial field • 1 quant attribute per grid cell –identifying what type of critical point • task • 1 quant attribute per grid cell –flow glyphs is at a specific location • derived data • purely local –shape understanding, spatial –predicting where a particle starting at –geometric flow relationships –isoline geometry a specified point will end up [Interactive Volume Rendering Techniques. Kniss. Master’s thesis, University of Utah Computer Science, 2002.] • derived data from tracing particle (advection) • isosurface • isocontours computed for D trajectories specific levels of scalar values –derived data: isocontours computed for [Comparing 2D vector field visualization methods: A user study. Laidlaw et al. IEEE Trans. [Comparing 2D vector field visualization methods: A user study. Laidlaw et al. IEEE Trans. • sparse set of seed points Visualization and Computer Graphics (TVCG) 11:1 (2005), 59–70.] Visualization and Computer Graphics (TVCG) 11:1 (2005), 59–70.] F specific levels of scalar values –texture flow C • direct volume rendering • derived data, dense seeds –feature flow –transfer function maps scalar values to B color, opacity • global computation to detect features Land Information New Zealand Data Service E – encoded with one of methods above [Topology tracking for the visualization of time-dependent two-dimensional flows. Tricoche, [Topology tracking for the visualization of time-dependent two-dimensional flows. Tricoche, [Multidimensional Transfer Functions for Volume Rendering. Kniss, Kindlmann, and Hansen. In The Visualization Handbook, Wischgoll, Scheuermann, and Hagen. Computers & Graphics 26:2 (2002), 249–257.] Wischgoll, Scheuermann, and Hagen. Computers & Graphics 26:2 (2002), 249–257.] 9 edited by Charles Hansen and Christopher Johnson, pp. 189–210. Elsevier, 2005.] 10 11 12 Idiom: similarity-clustered streamlines Arrange networks and trees Idiom: force-directed placement • data • visual encoding Node–Link Diagrams –3D vector field –link connection marks, node point marks Connection Marks • considerations • derived data (from field) NETWORKS TREES –streamlines: trajectory particle will follow –spatial position: no meaning directly encoded • left free to minimize crossings • derived data (per streamline) –proximity semantics? Ch 9: Arrange Network Data –curvature, torsion, tortuosity Adjacency Matrix • sometimes meaningful Derived Table –signature: complex weighted combination • sometimes arbitrary, artifact of layout algorithm NETWORKS TREES –compute cluster hierarchy across all signatures • tension with length –encode: color and opacity by cluster – long edges more visually salient than short • tasks • tasks Enclosure –explore topology; locate paths, clusters –find features, query shape Containment Marks • scalability • scalability [Similarity Measures for Enhancing Interactive Streamline Seeding. McLoughlin,. Jones, Laramee, Malki, Masters, and. Hansen. IEEE Trans. NETWORKS TREES Visualization and Computer Graphics 19:8 (2013), 1342–1353.] –node/edge density E < 4N –millions of samples, hundreds of streamlines http://mbostock.github.com/d3/ex/force.html 13 14 15 16
Recommend
More recommend