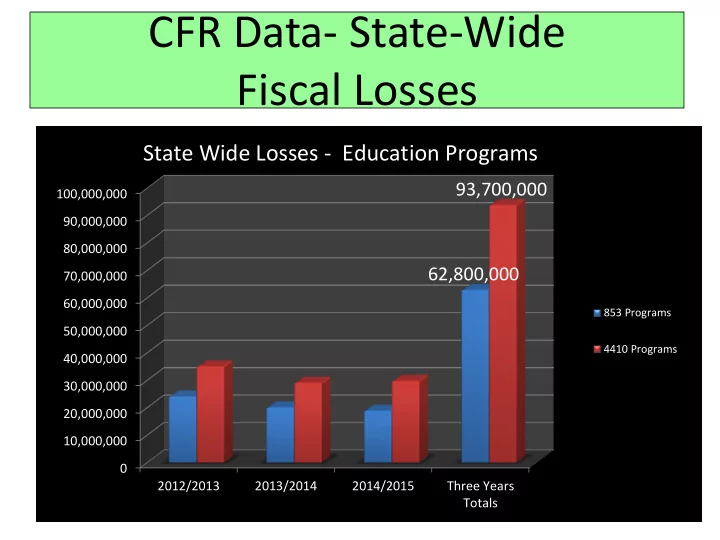

CFR Data- State-Wide Fiscal Losses State Wide Losses - Education Programs 93,700,000 100,000,000 90,000,000 80,000,000 62,800,000 70,000,000 60,000,000 853 Programs 50,000,000 4410 Programs 40,000,000 30,000,000 20,000,000 10,000,000 0 2012/2013 2013/2014 2014/2015 Three Years Totals
3 Year Average Teacher Salary BEDS Data – 50%tile – 2010-2013 $120,000.00 $98,536.00 $100,000.00 $93,721.00 $80,000.00 $72,990.00 $61,482.00 $56,099.00 $60,000.00 $52,931.00 $51,690.00 $43,509.00 $40,000.00 $20,000.00 $0.00 NYC Long Island - Nassau & Suffolk Mid Hudson Rest of New York State FY 2010 - 2013 4410 & 853 Approved Programs 12 Months FY 2010 - 2013 Public School Districts 10 Months
Disparity in Teacher Salaries Has Increased The disparity between what 4410 and 853 providers can pay their teachers and what the public school districts can pay their teachers has increased significantly over the past 7 years NYC Long Island - Nassau & Suffolk Mid Hudson Rest of New York State Long Island - Nassau & NYC Mid Hudson Rest of New York State Suffolk Teacher Salary Differential FY - 2006 - 2009 $16,008.00 $31,384.00 $20,138.00 $8,523.00 Teacher Salary Differential FY - 2010 - 2013 $20,059.00 $46,846.00 $32,239.00 $12,590.00
The Cost of 853 Tuition vs. District 75 NY State NYC District 75 Approved 853 Program – School- $50,679* $89,887 It would cost $39,200 dollars more per student if s/he went to a NYC D. 75 School If a school closed and 500 students moved, the increased cost per year would be $ 19,600,000. *2016-17 NYC Regional Weighted Average Per Diem Tuition Rates
Recommend
More recommend