CaDaDis: A Tool for Displaying the Behavior of Cognitive Models and - PDF document
In Proceedings of the 13th Conference on Behavior Representation in Modeling and Simulation. 04-BRIMS-032. 192-200. Orlando, FL: U. of Central Florida. www.sisostds.org/conference/index.cfm?conf=04brims CaDaDis: A Tool for Displaying the
In Proceedings of the 13th Conference on Behavior Representation in Modeling and Simulation. 04-BRIMS-032. 192-200. Orlando, FL: U. of Central Florida. www.sisostds.org/conference/index.cfm?conf=04brims CaDaDis: A Tool for Displaying the Behavior of Cognitive Models and Agents Kevin Tor Frank E. Ritter Steven R. Haynes School of Information Sciences and Technology The Pennsylvania State University University Park, PA 16801-3857 tor@cse.psu.edu, frank.ritter@ist.psu.edu, shaynes@ist.psu.edu Mark A. Cohen Business Administration, Computer Science, and Information Technology Lock Haven University Lock Haven, PA 17745 mcohen@lhup.edu Keywords: Cognitive Model Display, Model Interfaces, Model Behavior, Cognitive Architectures, Agent Behavior ABSTRACT : We introduce an extension to an architecture-independent tool (VISTA) for creating displays of cognitive model behavior, the Categorical Data Display (CaDaDis). Our display offers several views of categorical data. It includes a standard Pert Chart showing tasks by category (or resource), a Nonstandard Pert Chart that shows the temporal dependencies, and a Gantt chart that helps show occurrences of agent events along a time line. Perhaps most usefully, it can display categorical and numeric data generated by models as they run. CaDaDis can be used by different cognitive architectures because it has a general interface and creates its displays based on structured messages across a network socket. Its use is illustrated with three, domain-distinct Soar and ACT-R models. displays created quickly to work with Soar and ACT-R. 1. Introduction These displays helped us understand the models we did not write ourselves, and show the types of knowledge that Textual traces from cognitive models are often considered can be gleaned from models using categorical displays of unhelpful by observers trying to understand them, and these their internal processing. We hope that the reader ends traces are essentially unintelligible to non-programmers. up inspired to create such displays for their model, and Modelers and subject matter experts want to know the that they use our system, CaDaDis. structure of models as well as how they work [1, 2]. One approach that has been relatively well received is to provide 2. Review of Previous Systems a graphic representation of model’s internal processing and behavior. Where this has been done, observers have at least thought they understood the models more, and in some A wide range of graphical displays have been used by cases have seen and learned new things about their models. cognitive models. Not every model and not every cognitive architecture has had one, but the displays that have been available appear to help explain models. We We present a general tool for displaying categorical data generated by cognitive models and AI agents. It can be examine here several of the displays to show the processing within cognitive models to frame a set of used by multiple agent and cognitive architectures to display their internal processing. It is based on a no-cost lessons for the design of our tool. toolkit and implemented in a widely used programming language and should help many models to be understood. 2.1 CPM-GOMS The display tool is designed to support the reuse that Newell [3] referred to in his book, in this case by helping Gray, John, and Atwood [4] created a task analysis in models be understood and by being used itself in multiple CPM-GOMS (Critical Path Method/Cognitive- applications. Perceptual-Motor GOMS) for a new and old telephone workstation. They used a modified Pert Chart to represent the sub-tasks and their dependencies. The tasks We start by describing several displays that have inspired us and provide lessons for our design. We provide example were aligned by the type of resource they used (voice- 1
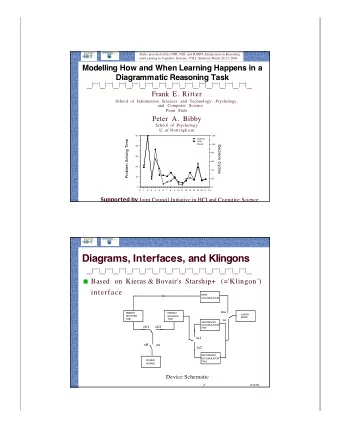
input, visual-input, cognition, and motor output). The modified Pert Chart gave a critical path analysis that allowed estimating the total task time. The displays were created by hand in Microsoft Project, and represented the GOMS model's predictions and interaction. The displays, while not fully released because they included proprietary data, were used in presentations and papers to explain the process of the model's development, to illustrate the behavior, to debug the models, and to compute the time per task on the new and old workstations (the new workstation was millions of dollars more expensive when the users' task time was included). While the displays were useful, creation of the displays by hand was time consuming and slightly error-prone. This work illustrated several of the uses of model displays, including the creation and debugging of the model, as well as the important role such displays can play in presenting Figure 2.1 Example operator trace from the DSI, a plot the model to a variety of audiences. A general display for generated in S-Plus (Taken from Ritter and Bibby [11]). cognitive models should help with creating models, help with debugging models, and provide displays that can be Loading and running several models in the DSI showed included in papers and presentations to help explain the that Soar models did not have the control structure that models, including conference tutorials. had been expoused in Newell's book [3], that of search within problem spaces — the models typically did search 2.2 APEX across problem spaces, or did little search at all [8, 12]. APEX [5] is a tool to evaluate interfaces. It has been The Tcl/Tk Soar Interface (TSI) [13] provides multiple extended to have its models and predictions implement the views of the working memory and decision processes of a CPM-GOMS architecture [6]. It automatically generates Soar agent, including a semi-graphical trace of the goal pictorial representations of the actions and their stack and the operators in a Soar model. Like the DSI, it dependencies. These displays have been used extensively works with all models, is a great aid for teaching, and is in tutorials [7]. useful for novice Soar programmers. Its displays, however, have not often been used in presentations, APEX showed that automatic displays of the PERT charts perhaps because they are mainly textual and are could be created, and provided partial answers to the somewhat dense graphically. interface needs, including scrolling displays for models with more actions than can fit in a simple display window. Both of these systems provide further examples that This display has been successful enough that a version of it graphical displays of the models and of their behavior can has been included in the ACT-R architecture. be helpful to a wide range of users. They also both show that displays can be independent of models. 2.3 The DSI and the TSI 2.4 Connectionist Modeling Tools The Developmental Soar Interface (DSI) was created to support model creation, debugging, and presentations in The connectionist model community initially had rather Soar 4 [8]. It provided a graphical trace for any Soar model poor interfaces that would print out all of the nodes each of the problem spaces, states, and operators and their epoch (e.g., the early PDP toolkits). But the users could emergent temporal structure. A display of the active states at least see the processing of their model. The graphic and operators and their problem spaces were used to create displays that came later (e.g., the PDP++ toolkit, [14]) a video [9] about Soar. More advanced displays of the were no doubt a major contributor to the ease of use and operators were used to show which actions matched with uptake of this type of model. Later displays, with their human data. These displays showed the cyclical nature of a color and nice design even created at times, we suggest, a Soar model [10], and also where learning occurred within a sense of enjoyment in modeling that has not often been task [11]. An example is shown in Figure 2.1. experienced with symbolic models. The availability of 2
Recommend
More recommend
Explore More Topics
Stay informed with curated content and fresh updates.
