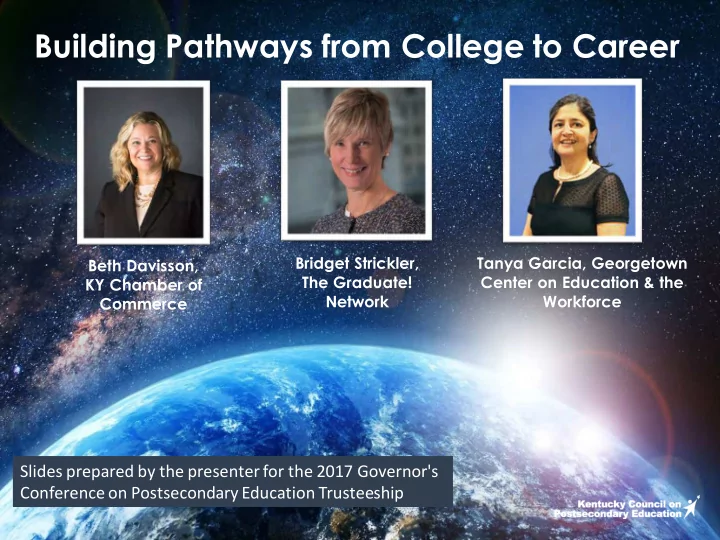

Building Pathways from College to Career Bridget Strickler, Tanya Garcia, Georgetown Beth Davisson, The Graduate! Center on Education & the KY Chamber of Network Workforce Commerce Slides prepared by the presenter for the 2017 Governor's Conference on Postsecondary Education Trusteeship
#CEW5Ways
• • • • •
• • • • •
Bridging The Talent Gap: The Kentucky Talent Alignment Survey www.BridgingTheTalentGap.org Beth Davisson, Executive Director, The Workforce Center, Kentucky Chamber of Commerce Bridgett Strickler, Director of Network Engagement, The Graduate! Network
www.BridgingTheTalentGap.org
2016 Cohort Summary Locations Jacksonville, FL Louisville, KY Trenton, NJ Southern Indiana Spokane, WA Tennessee TOTAL Participants 609 BRIDGING THE TALENT GAP — TALENT ALIGNMENT SURVEY 21
Kentucky Talent Alignment Survey Summary 2017 Kentucky WIA Completed Partial Nominal Total Usable (C + P) 156 62 8 218 BLUEGRASS 51 13 4 64 CUMBERLANDS 42 14 2 56 EKCEP 63 29 4 92 GREEN RIVER 161 76 14 237 KENTUCKIANA WORKS 91 30 8 121 LINCOLN TRAIL 103 30 2 133 NORTHERN KENTUCKY 60 17 1 77 SOUTH CENTRAL 14 4 1 18 TENCO 44 18 5 62 WEST KENTUCKY 6 350 6 UNIDENTIFIED 785 299 399 1084 TOTALS BRIDGING THE TALENT GAP — TALENT ALIGNMENT SURVEY 22
Industry Distribution Manufacturing (287) Health Care & Social Assistance (157) Professional, Scientific & Technical Services (126) Educational Services (87) Finance & Insurance (98) BRIDGING THE TALENT GAP — TALENT ALIGNMENT SURVEY 23
Employer Size Organization Size 55% Small Employers < 200 employees 31% 31% Medium Employers 201-500 employees 55% 14% Large Employers >500 employees 14% Small Medium-sized Large BRIDGING THE TALENT GAP — TALENT ALIGNMENT SURVEY 24
Expected Growth Percent of respondents expecting growth for their organization, next 3-5 years Expected growth for my organization, next 3-5 years 82% Manufacturing 2016 Cohort: 81% 86% 2017 Kentucky: 81% 87% Health Care 79% Professional, Scientific, & 90% Technical Services 80% 0% 20% 40% 60% 80% 100% 2016 Cohort 2017 Kentucky BRIDGING THE TALENT GAP — TALENT ALIGNMENT SURVEY 25
Percent anticipating growth in next 3-5 years (by Region) 100% 80% 81% (State Average) 60% 40% 20% 0% BRIDGING THE TALENT GAP — TALENT ALIGNMENT SURVEY 26
Recruiting and Hiring Are Difficult Everywhere Recruitment & Hiring For New Skills Most Difficult Jobs to Fill (percent of respondents saying somewhat/very difficult) (percent of respondents saying somewhat/very difficult) 90% 80% High Skill Medical Difficulty recruiting 85% qualified workers 84% 85% Skilled Trades 85% Difficulty hiring FT 83% positions needing 81% Engineers 85% new/updated skills 83% 0% 20% 40% 60% 80% 100% 0% 20% 40% 60% 80% 100% 2016 Cohort 2017 Kentucky 2016 Cohort 2017 Kentucky BRIDGING THE TALENT GAP — TALENT ALIGNMENT SURVEY 27
Reasons for Hiring Difficulties Percent of respondents indicating reasons for hiring difficulties 56% Competition from other employers 59% 46% Candidates do not have the right skills 54% Candidates do not have the right work 43% 54% experience Local education/training system does not 25% 26% produce enough work ready/qualified… 0% 20% 40% 60% 80% 100% 2016 Cohort 2017 Kentucky BRIDGING THE TALENT GAP — TALENT ALIGNMENT SURVEY 28
Applied work skills are built on education attainment Percent of respondents saying labor pool possesses 100% Applied Skills applied skills • Diversity 79% 77% 80% • Information Technology Application 66% 64% 60% • Leadership 51% 42% • Problem Solving 40% • Teamwork/Collaboration 20% 0% High Associate's Bachelor's School Degree Degree 2017 Kentucky 2016 Cohort Diploma BRIDGING THE TALENT GAP — TALENT ALIGNMENT SURVEY 29
Percent anticipating an increase in hiring over next 5 years • High School Diploma (Average 34%) • Industry/Professional Org Certificate (Average 41%) • Associate’s Degree (Average 29%) • Bachelor’s Degree (Average 41%) BRIDGING THE TALENT GAP — TALENT ALIGNMENT SURVEY 30
Learning Landscape
For More Information, to Get Involved or Stay Connected:
Recommend
More recommend