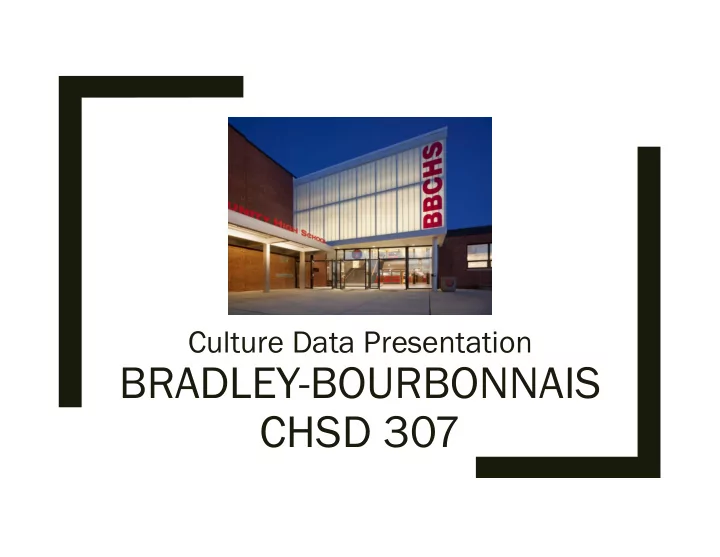

Culture Data Presentation BRADLEY-BOURBONNAIS CHSD 307
Career Ready (ISBE Proposal) ■ 90% Attendance ■ 25 Hours of Community Service ■ Industry Credential ■ Two or more organized Co-Curricular Activities ■ Dual Credit Career Pathway Course
How does BBCHS fare? ■ Attendance Rate: 92% ■ Community Service: – All students required to complete a 4 hour community service project to graduate through Civics class – 29 Sports/Activities complete service projects ■ Athletics/Activity – 1044 Students in activities/athletics ■ KACC Students: 217 /2094 (10.4%) ■ Microsoft Office and Excel Certification
STUDENT ENROLLMENT AND PROJECTED ENROLLMENT (FALL OF EACH SCHOOL YEAR) 2300 2200 2100 2000 1900 1800 1700 2009 2010 2011 2012 2013 2014 2015 2016 2017 2018 2019 2020 2021 2022 2023 Enrollment Estimated
STUDENT DEMOGRAPHIC DATA
STUDENT DEMOGRAPHIC DATA
STUDENT DEMOGRAPHIC DATA
BBCHS STAFFING Ø Administrators…................12 Ø Teachers..........................116 Support Staff..................105 Ø
STAFF DEMOGRAPHICS HIGHLIGHTS ■ 116 TEACHERS AT BBCHS
STAFF DEMOGRAPHICS HIGHLIGHTS
STAFF DEMOGRAPHICS HIGHLIGHTS
STAFF DEMOGRAPHICS HIGHLIGHTS
STAFF DEMOGRAPHICS HIGHLIGHTS
STAFF DEMOGRAPHICS HIGHLIGHTS ■ 12 TOTAL ADMINISTRATORS AT BBCHS
FACULTY RENTENTION DATA BY COHORT 2006 - 2016 90% 81.30% 72.70% 73.30% 69.20% 80% 70% 57.10% 53.30% 60% 50.00% 46.70% 45.00% 50% 40.00% 40% 28.60% 30% 20% 10% 0% 2006 2007 2008 2009 2010 2011 2012 2013 2014 2015 2016
FACULTY TURNOVER RATE 20 15 10 5 0 2011 2012 2013 2014 2015 2016 2017
REASONS FOR FACULTY RESIGNATION (Since 2012) 25.00% 22.78% 20.25% 20.00% 15.00% 12.66% 12.66% 12.66% 10.00% 7.59% 5.06% 5.00% 3.80% 1.27% 1.27% 0.00%
LOCATION OF FACULTY’S RESIDENCE Outside In Kankakee Kankakee County County 17% 23% In District 307 60% In Kankakee County In District 307 Outside Kankakee County
ADDITIONAL DEMOGRAPHIC INFORMATION Married Single in Kankakee Co. Single Outside of Kankakee Co. 12% 15% 73%
RETIREMENT PROJECTIONS 2018-2028 1-2 Years 3-5 years 6-8 Years 9-10 Years 0 2 4 6 8 10 12 14 Administrators Teachers
Student, Family, and Staff Satisfaction
Student, Family, and Staff Satisfaction
What to consider? (Community Survey Results)
School Improvement Survey Highlights
Staff Needs
Community Survey
Student Engagement Inventory
Student Affairs Data Total Referrals by Event Ye Year To Total OS OSS IS ISS %B %Black %Hi Hispanic/ %White %W %Free/ %F (1 (11%) La Latino no (7 (74.5%) Re Reduced (8.3%) (8 (3 (39%) 13-14 6410 352 1225 25% 11% 56% 60% 14-15 7101 382 1084 21% 10% 62% 63% 15-16 6268 174 892 22% 12% 58% 62% 16-17 9052 79 979 24% 12% 57% 60%
Questions
Recommend
More recommend