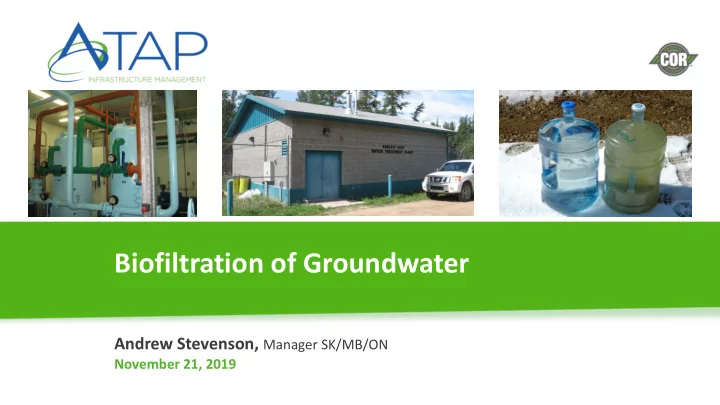

Biofiltration of Groundwater Andrew Stevenson, Manager SK/MB/ON November 21, 2019
New Challenges - New Solutions: Innovative Technologies
Overview • Biofiltration concepts • Example of a small groundwater system • What we learned
What is Biological Filtration?
Biofiltration • Exploiting naturally occurring bacterial growth to purify drinking water • Given proper environmental conditions, bacteria can use undesirable compounds in the raw water to gain energy or nutrients • Usage by bacteria = removal or conversion of compounds • Encourage growth of bacteria on filter media
Change in Philosophy - Membranes • Traditional philosophy of membrane technology (esp. RO) was that it could solve any water treatment problem • Communities experienced fouling and clogging of membranes with difficult source water that left membrane plants wanting • Membrane plants treat many problems, but it is not a sustainable method to treat all waters • Excessive backwashing, fouling of membranes and membrane replacement is costly
Biofiltration Benefits • Reduced chemicals usage • Simple treatment – operator friendly • No biological fouling of water treatment equipment, such as membranes (less waste) • Production of biologically stable water, which means low bacteria re- growth potential in distribution systems • Low chlorine demand of finished water very little chlorine residual decay in distribution systems (ammonia, organics reduction)
Biological Treatment Feasibility • Inorganics: nitrate, ammonia, perchlorate, bromate, arsenic, sulfide, iron, & manganese • Organics: dissolved organic carbon, taste & odour, trace organics
Bugs Need a Home • Provides a ‘hotel’ for bacteria • A combination of biological and physical-chemical processes occur • Provides the right conditions (food source, environmental)
Backwash • Most facilities use non-chlorinated water in a dedicated backwash tank • Air scour is helpful in removing debris and film from media • Simultaneous air and water scour followed by fluidization of media is preferred • backwash is maintained at ~15 L/s until water is clear • take samples of backwash waste to check for lost media • filter to waste, if required
Backwash
Instrumentation • Conductivity • pH • Flow • Pressure (differential)
Record Keeping • Daily log sheets • Chemicals usage • Water quality • Pump runs • Plant flows • Minor and major upsets
RO Prefilters
Eagles Lake - SK
Eagles Lake WTP
Biological Treatment Feasibility • Groundwater source ~180 cu. m/day capacity • Existing Process: Greensand Filtration + Sodium Hypochlorite Disinfection • High ammonia ~3.5 mg/L • High Iron ~3 mg/L • Manganese ~ 0.350 mg/L • Free chlorination not practiced due to high ammonia levels
Existing WTP Performance Parameter Raw (mg/L) Treated (mg/L) GCDWQ Ammonia 3.1 2.4 - Arsenic 0.041 0.002 0.01 Iron 3.66 0.07 0.3 Manganese 0.11 0.048 0.1/0.02 Hardness 443 429 - TDS 938 956 500 DOC 5.2 - -
Performance Issues • High chlorine demand >30 mg/L by ammonia • Exceeds NSF application limit for sodium hypochlorite and gas chlorination • Disinfection Concerns - 4-log Virus inactivation needed • Chloramination cannot provide 4-log virus disinfection • UV disinfection if not feasible (UVT<70%) • Ammonia removal necessary
Biological Filtration Plus Membranes (typical) • Air and oxygen injection • Staged biofilters – Iron Ammonia/Manganese • NF/RO Membranes - Demineralization • pH correction – caustic or pH contactor • Disinfection - chlorine
Biological Filtration Piloting Goal • Reduce ammonia below 1 mg/L to enable breakpoint chlorination & disinfection compliance • Reduce iron to less than 0.3 mg/L • Assess effect of natural biofiltration on arsenic, manganese and organics removal • Greensand filter for Mn
Biological Filtration Piloting
Eagles Lake Treatment Scheme
Biological Filtration Media Configuration Media Media Depth Purpose Filter Dia. (m) Description (m) Anthracite Biological Iron Removal 0.2 0.8 Activated Carbon Biological Ammonia Removal 0.1 0.8 Anthracite Biological Ammonia Removal 0.1 0.8 Ceramic Clay Biological Ammonia Removal 0.1 0.8 Natural Zeolite Ion Exchange Ammonia Removal 0.1 0.8 Anthracite/Greensand (partial Physical/ chemical Mn Removal 0.2 0.5 / 0.3 Operations)
Chlorine Demand – Before/After Ammonia BF
Manganese Removal Performance
Full-scale data - 2015-2018 • Raw water Ammonia = 3.2 - 3.5 mg/L • Iron: Biofilter effluent = 0.0 – 0.05 mg/L • Ammonia: Biofilter effluent = 0.0 – 0.1 mg/L • Manganese: Greensand filter effluent = 0.001 – 0.002 mg/L • Over 4 years in service • No issues noted by the operator
Iron & Ammonia Biological filters
Findings
Key Learnings – Iron & Manganese • Environmental conditions (pH, ORP, etc.) are important in iron & manganese biofiltration • Separate processes may be required for iron & manganese removal • Primary biofilter reduced iron & arsenic to acceptable levels • No organics reduction seen across biofilters tested
Key Learnings - Ammonia • Anthracite & GAC media appear to be better suited than the tested ceramic media • Ion exchange did not perform as well as GAC or anthracite biofilter • Converting Ion exchange media into biofiltration, ammonia removals were comparable to GAC & anthracite media
Key Learnings • Importance of piloting • Experienced operational support • Single consultant: • Design • Piloting • Construction • Commissioning • Many RO/biological examples over 15 years
Questions? Contact Andrew Stevenson, stevensona@ae.ca
Recommend
More recommend