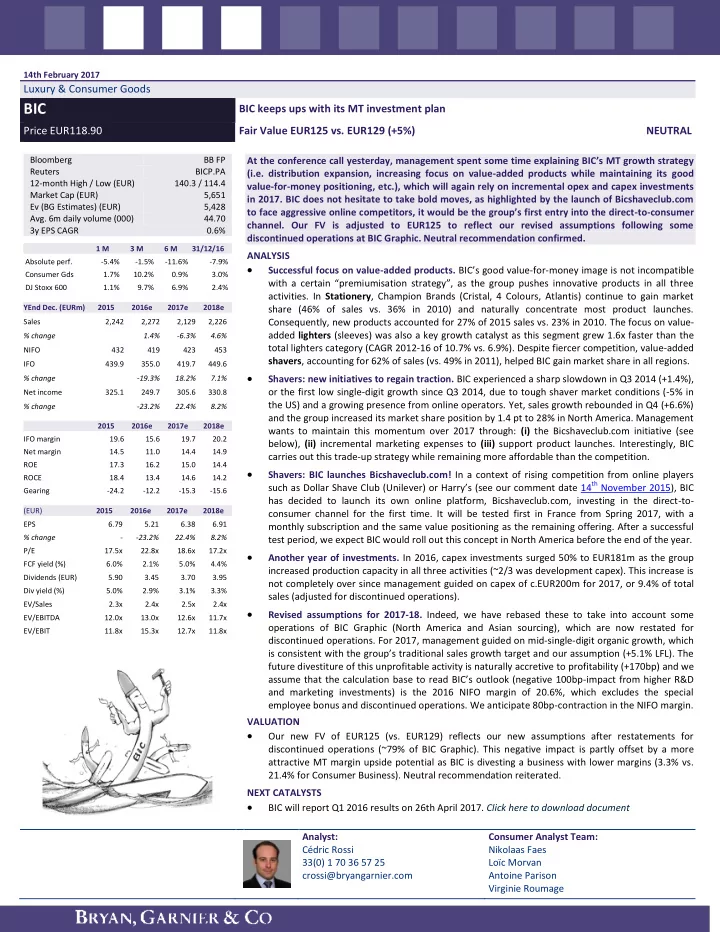

14th February 2017 Luxury & Consumer Goods BIC BIC keeps ups with its MT investment plan Price EUR118.90 Fair Value EUR125 vs. EUR129 (+5%) NEUTRAL Bloomberg BB FP At the conference call yesterday, management spent some time explaining BIC’s MT growth strategy Reuters BICP.PA (i.e. distribution expansion, increasing focus on value-added products while maintaining its good 12-month High / Low (EUR) 140.3 / 114.4 value-for-money positioning, etc.), which will again rely on incremental opex and capex investments Market Cap (EUR) 5,651 in 2017. BIC does not hesitate to take bold moves, as highlighted by the launch of Bicshaveclub.com Ev (BG Estimates) (EUR) 5,428 to face aggressive online competitors, it would be the group’s first entry into the direct -to-consumer Avg. 6m daily volume (000) 44.70 channel. Our FV is adjusted to EUR125 to reflect our revised assumptions following some 3y EPS CAGR 0.6% discontinued operations at BIC Graphic. Neutral recommendation confirmed. 1 M 3 M 6 M 31/12/16 ANALYSIS Absolute perf. -5.4% -1.5% -11.6% -7.9% Successful focus on value-added products. BIC’s good value -for-money image is not incompatible Consumer Gds 1.7% 10.2% 0.9% 3.0% with a certain “premiumisation strategy”, as the group pushes innovative products in all three DJ Stoxx 600 1.1% 9.7% 6.9% 2.4% activities. In Stationery , Champion Brands (Cristal, 4 Colours, Atlantis) continue to gain market YEnd Dec. (EURm) 2015 2016e 2017e 2018e share (46% of sales vs. 36% in 2010) and naturally concentrate most product launches. Consequently, new products accounted for 27% of 2015 sales vs. 23% in 2010. The focus on value- Sales 2,242 2,272 2,129 2,226 added lighters (sleeves) was also a key growth catalyst as this segment grew 1.6x faster than the % change 1.4% -6.3% 4.6% total lighters category (CAGR 2012-16 of 10.7% vs. 6.9%). Despite fiercer competition, value-added NIFO 432 419 423 453 shavers , accounting for 62% of sales (vs. 49% in 2011), helped BIC gain market share in all regions. IFO 439.9 355.0 419.7 449.6 % change -19.3% 18.2% 7.1% Shavers: new initiatives to regain traction. BIC experienced a sharp slowdown in Q3 2014 (+1.4%), or the first low single-digit growth since Q3 2014, due to tough shaver market conditions (-5% in Net income 325.1 249.7 305.6 330.8 the US) and a growing presence from online operators. Yet, sales growth rebounded in Q4 (+6.6%) % change -23.2% 22.4% 8.2% and the group increased its market share position by 1.4 pt to 28% in North America. Management 2015 2016e 2017e 2018e wants to maintain this momentum over 2017 through: (i) the Bicshaveclub.com initiative (see IFO margin 19.6 15.6 19.7 20.2 below), (ii) incremental marketing expenses to (iii) support product launches. Interestingly, BIC Net margin 14.5 11.0 14.4 14.9 carries out this trade-up strategy while remaining more affordable than the competition. ROE 17.3 16.2 15.0 14.4 Shavers: BIC launches Bicshaveclub.com! In a context of rising competition from online players ROCE 18.4 13.4 14.6 14.2 such as Dollar Shave Club (Unilever) or Harry’ s (see our comment date 14 th November 2015), BIC Gearing -24.2 -12.2 -15.3 -15.6 has decided to launch its own online platform, Bicshaveclub.com, investing in the direct-to- (EUR) 2015 2016e 2017e 2018e consumer channel for the first time. It will be tested first in France from Spring 2017, with a EPS 6.79 5.21 6.38 6.91 monthly subscription and the same value positioning as the remaining offering. After a successful % change - -23.2% 22.4% 8.2% test period, we expect BIC would roll out this concept in North America before the end of the year. P/E 17.5x 22.8x 18.6x 17.2x Another year of investments. In 2016, capex investments surged 50% to EUR181m as the group FCF yield (%) 6.0% 2.1% 5.0% 4.4% increased production capacity in all three activities (~2/3 was development capex). This increase is Dividends (EUR) 5.90 3.45 3.70 3.95 not completely over since management guided on capex of c.EUR200m for 2017, or 9.4% of total Div yield (%) 5.0% 2.9% 3.1% 3.3% sales (adjusted for discontinued operations). EV/Sales 2.3x 2.4x 2.5x 2.4x Revised assumptions for 2017-18. Indeed, we have rebased these to take into account some EV/EBITDA 12.0x 13.0x 12.6x 11.7x operations of BIC Graphic (North America and Asian sourcing), which are now restated for EV/EBIT 11.8x 15.3x 12.7x 11.8x discontinued operations. For 2017, management guided on mid-single-digit organic growth, which is consistent with the group’s traditional sales growth target and our assumption (+5.1% LFL). The future divestiture of this unprofitable activity is naturally accretive to profitability (+170bp) and we assume that the calculation base to read BIC’s outlook (negative 100bp -impact from higher R&D and marketing investments) is the 2016 NIFO margin of 20.6%, which excludes the special employee bonus and discontinued operations. We anticipate 80bp-contraction in the NIFO margin. VALUATION Our new FV of EUR125 (vs. EUR129) reflects our new assumptions after restatements for discontinued operations (~79% of BIC Graphic). This negative impact is partly offset by a more attractive MT margin upside potential as BIC is divesting a business with lower margins (3.3% vs. 21.4% for Consumer Business). Neutral recommendation reiterated. NEXT CATALYSTS BIC will report Q1 2016 results on 26th April 2017. Click here to download document Analyst: Consumer Analyst Team: Cédric Rossi Nikolaas Faes 33(0) 1 70 36 57 25 Loïc Morvan crossi@bryangarnier.com Antoine Parison Virginie Roumage
Recommend
More recommend