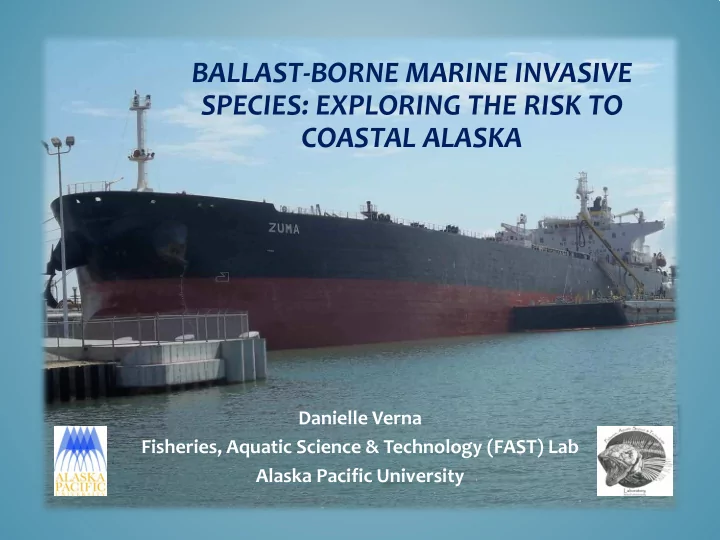

BALLAST-BORNE MARINE INVASIVE SPECIES: EXPLORING THE RISK TO COASTAL ALASKA Danielle Verna Fisheries, Aquatic Science & Technology (FAST) Lab Alaska Pacific University
PHASES OF BIOLOGICAL INTRODUCTIONS 1) 1500 AD - end of the Middle Ages, beginning of global exploration 2) 1800 AD - Industrial Revolution and mass European emigration 3) Present - “Era of Globalization” Hulme, 2009
BALLAST WATER http://minnesota.publicradio.org/display/web/2009/05/13/ballast_water_battle/
WHY BALLAST WATER? • Ships are the largest contributor of marine invasive species 1 • The international shipping industry transports ~3-5 billion MT of ballast annually 2 • Short voyage duration = greater organism survival 3 • Responsible for Comb jelly marine invasions Zebra mussel around the globe Northern Pacific Cholera seastar 1 Ruiz et al. 2000, 2 Endresen et al. 2004, 3 Lavoie et al. 1999
WHY BALLAST WATER? Changing environmental conditions have already resulted in increased vessel traffic in the Arctic & Bering Strait
STUDY DESIGN • Policy Review – Objectives: • Document changes in policy and identify drivers • Assess implications for BWM • Risk Assessment for Coastal Alaska – Objectives: • Assess ballast water discharge in Alaska, 2005 – 2012 • Develop risk assessment framework • Model risk for coastal Alaska
MAJOR POLICY SHIFTS IN BWM
MAJOR POLICY SHIFTS IN BWM
MAJOR POLICY SHIFTS IN BWM
BALLAST WATER MANAGEMENT • The globally accepted form is ballast water exchange: Empty – Refill Method Flow Through Method > 200 nm from shore • Management practices are reported to the National Ballast Information Clearinghouse http://invasions.si.edu/nbic/managementpract.html Coastwise : ballast water does not transit beyond combined US & Canadian EEZs Overseas : ballast water does transit beyond combined US & Canadian EEZs
BALLAST IN ALASKA, 2005 - 2012 • ~72% of ballast discharge was sourced on the US west coast or BC • Tankers discharge ~88% of all ballast 3,773 vessels 27,303 ballast tanks • Only 33% of reported ballast is 7.5 x10 7 MT of ballast managed (BWE) 67 named locations 910 geographic coordinates
TOTAL AK BALLAST WATER DISCHARGE: 2005 - 2012
Ballast Water Discharge in Prince William Sound: 2005 - 2012 Location Discharging Arrivals Volume (MT) Valdez 1414 5.8E+07 Seward 110 2.1E+06 PWS 105 1.6E+06 Afognak 64 5.4E+05 Kodiak 22 8.1E+04 Whittier 143 7.1E+04 KHA 3 2.8E+04 Cordova 5 1.3E+03
Ballast Water Discharge in Prince William Sound: 2005 - 2012 100.00% 100.00% 90.00% 90.00% 80.00% 80.00% 70.00% 70.00% 60.00% 60.00% Overseas Overseas 50.00% 50.00% Coastwise Coastwise 40.00% 40.00% Managed 30.00% 30.00% 20.00% 20.00% 10.00% 10.00% 0.00% 0.00%
Ballast Water Discharge in Prince William Sound: 2005 - 2012 Cordova Passenger/Other Bulker Knowles Head Anchorage Tanker Whittier Valdez Prince William Sound Kodiak Seward Afognak 0 5 10 15 20 Average Age of Ballast (days)
RISK ASSESSMENT 2009 – 2012 1. Model risk as a function of environmental similarity, ballast water age and volume – Between source and discharge regions – Between source region and ports >50,000 MT Following other high-latitude risk assessments: Leppäkoski & Gollasch 2006 Chan et al. 2013 Ware et al. 2013
RISK FRAMEWORK • Environmental Similarity ‣ (positively correlated with risk) 1) Low risk → non-adjacent ecoregion Spalding et al. 2007 2) Medium risk → adjacent ecoregion 3) High risk → same ecoregion – A weighted average was applied to the proximity ranking based on the volume per source ecoregion
RISK FRAMEWORK Ballast water age • (negatively correlated with risk) – Number of days between source and discharge date
RISK FRAMEWORK • Ballast water volume (positively correlated with risk) – Serves as a proxy for propagule pressure – 0.1 correction factor applied to managed ballast to represent 90% efficacy rate of BWE (Ruiz & Reid 2007)
ADDITIVE RISK SCALE Corrected mean volume of BW Environmental Similarity Age (days) discharge: ecoregions & ports (log 10 MT) (1) Low < 1 > 10 < 2.6 (2) Medium 1 – 2 6 – 10 2.6 – 5.1 (3) High > 2 < 6 > 5.1 Total Risk = sum of factors Total Risk 9 Extremely High 7 – 8 High 5 – 6 Medium 3 – 4 Low
RISK BY ECOREGION Marine Ecoregions of the World Spalding et al. 2007
RISK BY PORT Ports that received > 50,000 MT of ballast
CHANGING RISK BY PORT (2012 – 2009) Prince William Sound Env Sim Cordova Volume Knowles Head Anchorage Age Kodiak Whittier Anchorage Seward Nikiski Afognak Valdez No Change Red Dog Ketchikan Hydaburg Dutch Harbor Klawock Hawk Inlet Skagway Drift River Terminal Tolstoi Bay -6 -5 -4 -3 -2 -1 0 1 2 3 4 5 6
CONCLUSIONS • Southcentral AK receives the greatest volume of ballast discharge • Tankers pose the greatest risk due to ballast volume and age • Policy exemptions elevate risk and hinder monitoring • Recent and expected changes in BW discharge may be predictive of new areas of high risk Carcinus maenas Didemnum vexillum
Acknowledgements
Questions?
Recommend
More recommend