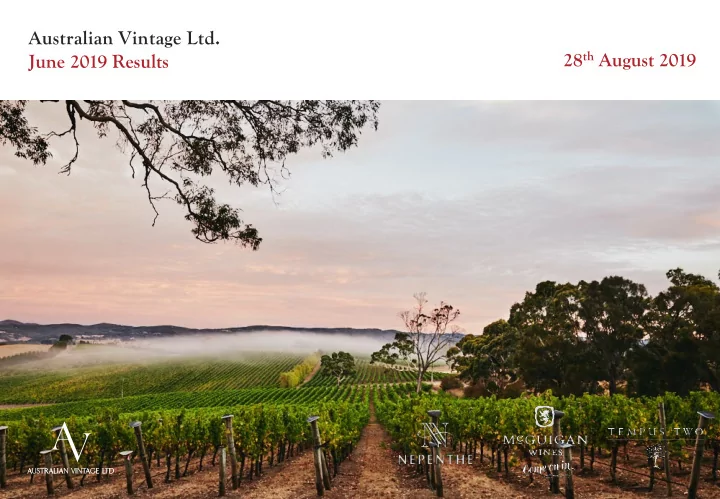
Australian Vintage Ltd. 28 th August 2019 June 2019 Results
Australian Vintage Ltd. Australian Vintage Ltd. June 2019 Results Disclaimer The presentation has been prepared by Australian Vintage Limited the industry, countries and markets in which AVG operate. They also (ACN 052 179 932) (“AVG”) (including its subsidiaries, affiliates and include general economic conditions, exchange rates, interest rates, the associated companies) and provides general background information regulatory environment, competitive pressures, selling price, market about AVG’s activities as at the date of this presentation. The demand and conditions in the financial markets which may cause information does not purport to be complete, is given in summary and objectives to change or may cause outcomes not to be realised. may change without notice. None of AVG (and their respective officers, employees or agents) (the This presentation is not intended to be relied upon as advice to Relevant Persons) makes any representation, assurance or guarantee as investors or potential investors and does not take into account the to the accuracy or likelihood of fulfilment of any forward looking investment objectives, financial situation or needs of any particular statement or any outcomes expressed or implied in any forward looking investor. These should be considered, with or without professional statements. The forward looking statements in this presentation reflect advice, when deciding if an investment is appropriate. The presentation views held only at the date of this presentation. Except as required by does not constitute or form part of an offer to buy or sell AVG applicable law or the ASX Listing Rules, the Relevant Persons disclaim securities. any obligation or undertaking to publicly update any forward looking statements, whether as a result of new information or future events. This presentation contains forward looking statements, including Statements about past performance are not necessarily indicative of statements of current intention, statements of opinion and predictions future performance. as to possible future events. Such statements are not statements of fact and there can be no certainty of outcome in relation to the matters to Certain jurisdictions may restrict the release, publication or distribution which the statements relate. These forward looking statements involve of this presentation. Persons in such jurisdictions should observe such known and unknown risks, uncertainties, assumptions and other restrictions. To the extent permitted by law the Relevant Persons do not important factors that could cause the actual outcomes to be materially accept liability for any use of this presentation, its contents or anything different from the events or results expressed or implied by such arising in connection thereto including any liability arising from the statements. Those risks, uncertainties, assumptions and other important fault or negligence none of the Relevant Persons. factors are not all within the control of AVG and cannot be predicted by AVG and include changes in circumstances or events that may cause objectives to change as well as risks, circumstances and events specific to 2
Business Results & Summary Outlook Wine Show Results / Key Points Australian Wine Industry Key Brand Facts Key Points • EBITS (Earnings before Interest, Tax and SGARA) up 30% to $21.7 million • Net Profit after Tax (NPAT) and before SGARA up 48% to $11.9 million • 2019 vintage conditions impacted result by negative $4.9 million compared to prior period • NPAT up 6% to $8.1 million • Cash Flow from Operating Activities positive $23.6 million • Net Debt of $72.4 million compared to $77.2 million as at 30 June 2018 • Revenue up $19.7 million to $269.2 million • Sales of McGuigan, Tempus Two and Nepenthe up 10% • 2.0 cent per share fully franked final dividend declared. Dividend Reinvestment Plan suspended. June 2019 Results 3
Business Results & Summary Outlook Wine Show Results / Key Points Australian Wine Industry Key Brand Facts Australian Wine Industry In the 12 months to June 2019 the value of Australian wine exports increased by 4% to $2.9 billion and volume decreased by 6% to 801 million litres. The volume decline was driven by a decrease of 7% in shipments below an average value of $2.50 per litre. The average value of exports grew by 10% to $3.58 per litre, the highest since 2009. The decline in overall exported volume is due to: • Australia’s 2018 and 2019 vintages were smaller than the record breaking 2017 vintage, resulting in less supply for shipping overseas • International supply pressures have eased with a larger 2018 global vintage, increasing competition in the market • Premiumisation in established markets is pushing down volume and increasing value June 2019 Results 4
Business Results & Summary Outlook Wine Show Results / Key Points Australian Wine Industry Key Brand Facts Australian Wine Industry (cont.) Wine exports to China continues to lead growth with sales up 8% to $1.1 billion. China remains the largest market for wine sales and third by volume. Other key export markets: • UK export sales decreased by 3% to $372.7 million but remains the largest export market by volume which was down 4% to 236.2 million litres. • US export sales increased by 2% to $432.0 million and volume decreased by 4% to 152. 5 million litres. • Canada export sales remained flat at $198.0 million and volume decreased by 4% to 66.0 million litres. • NZ export sales increased by 9% to $99.3 million and volume was up 5% to 33 million litres. June 2019 Results 5
Business Results & Summary Outlook Wine Show Results / Key Points Australian Wine Industry Key Brand Facts Australian Wine Industry (cont.) The 2019 Vintage crush has been estimated at 1.73 million tonnes, a decrease of 3% on last year’s crush. (Wine Australia – National Vintage Report July 2019). The crush is very close to the long term average of 1.75 million tonnes. A final 2019 Vintage crush will be provided by the Department of Agriculture prior to the 2020 vintage. The crush in cool temperate regions decreased by 5% and warm regions the crush decreased by 2%. Average wine grape purchase prices increased across all regions with the average for all varieties increased by 9% to $664 per tonne – the highest since 2008. The largest percentage increase in average grape price was in warm climate reds, which increased by 26% to $592 per tonne. Warm climate whites increased by 9% to $361 per tonne. Since 2011, the average grape price has increased by a compound average rate of 6%. June 2019 Results 6
Business Results & Summary Outlook Wine Show Results / Key Points Australian Wine Industry Key Brand Facts Business Results & Summary 1. Branded Sales During the 12 months to June 2019 total sales of our three key brands, McGuigan, Tempus Two and Nepenthe increased by 10%. These three products now represent 60% of all our sales. In the UK/Europe market McGuigan branded sales have grown by 13% and is the third largest global brand in that market. Within the McGuigan brand, the higher priced Black Label and Reserve range have grown by 31% and now represent 40% of all our sales to UK/Europe. In Australia, the McGuigan branded sales have grown by 8% and the higher priced Tempus Two and Nepenthe brand sales have grown by 6%. 5 years ago, Tempus Two represented 10% of total bottled sales in Australia and now it is 18%. Sales of lower margin products such as Miranda declined 9% during the year. In 2018 we released a new brand called Barossa Valley Wine Company. Whilst only representing 2% of total Australian sales, this higher priced brand has seen sales increased by 269% over the last 12 months. June 2019 Results 7
Recommend
More recommend
Unleash a World of Digital Possibilities—Browse, Share, and Explore Content Without Boundaries