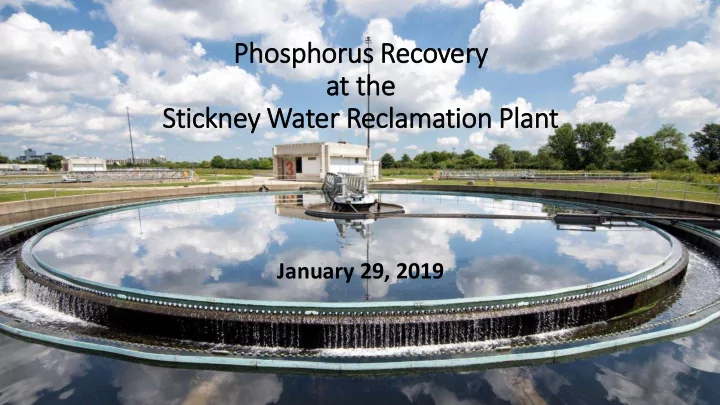

Phosphorus Recovery ry at the Stic ickney Water Reclamation Pla lant January 29, 2019
Background
Nutrient Standards Development 2001 – PRESENT IEPA developing defensible nutrient standards 2000 1998 2006 2015 IEPA requested to USEPA initiated IEPA/IPCB IEPA finalized the develop nutrient nutrient criteria promulgated the Illinois Nutrient Loss standards for the state development Interim P Rule Reduction Strategy 2011 (1 mg/L TP as 2000 IEPA renewed its monthly average USEPA finalized 14 efforts to develop for new and ecoregional nutrient criteria nutrient standards expanding recommendations for with 4 working WWTPs) streams and rivers groups Ecoregion VI, Corn Belt and Great plain: 0.076 mg/L TP and 2.18 mg/L TN
District Nutrient Efforts – Strategic Plan for Resource Recovery and Sustainability 2011 2002 • Informed IEPA on steps: Formed Nutrient 2013 − Task Force to To biologically remove P u sing Converted all SWRP to identify needs existing infrastructure 2005 EBPR configuration − Recover P where possible Awarded contract for Conducted pilot nutrient − To work within District’s long removal test for a WERF construction of a P term strategic plan on resource project recovery facility at SWRP recovery and sustainability 2012 2007-08 Formed a District-wide Incorporated Conducted full scale study at Egan Phosphorus Task Force to nutrient WRP using chemical P removal study and implement of EBPR standards method Full-scale test in one battery at into master the Stickney WRP plans 2014 2001 – PRESENT New NPDES permit Actively participating in IEPA Nutrient Standards development with special condition for new P limit to be met by 2018
P Removal l from Main instream
Sti Stickney Water Recla lamation Pl Plan ant • Serves 2.38 million people • Flows: − Avg Design Capacity: 1,200 MGD − Average 2014-16: 700 MGD • 4 aeration batteries − 8 tanks/battery − 4 passes/tank − 96 circular secondary clarifiers Battery B Battery A Battery D Battery C
Conversion for EBPR (AAnO) ) at t th the St Stickney WRP PE P4 P3 P2 P1 Aerobic zone Mixing Channel NS RAS Channel Anaerobic zone Influent Channel Anoxic zone EW RAS Channel RAS
[TP] @ Outfall, Battery D (mg/L) 0.00 0.20 0.40 0.60 0.80 1.00 1.20 1.40 1.60 1.80 May-12 Jun-12 Jul-12 Aug-12 Outfall TP: 1.16 mg/L Sep-12 PE TP: 4.7 mg/L Oct-12 Nov-12 Sti Dec-12 tickney EBPR Progress – Monthly Means Jan-13 Feb-13 Mar-13 Apr-13 May-13 Jun-13 Jul-13 Aug-13 Sep-13 Oct-13 Nov-13 ST Plant Outfall TP Dec-13 Jan-14 Feb-14 Mar-14 Apr-14 May-14 Jun-14 Jul-14 PE WEIGHTED TP Aug-14 Sep-14 Outfall TP: 0.86 mg/L Oct-14 PE TP: 7.6 mg/L Nov-14 Dec-14 Jan-15 Feb-15 Mar-15 Apr-15 May-15 Jun-15 Jul-15 Aug-15 Sep-15 Oct-15 Nov-15 Dec-15 Jan-16 Feb-16 Mar-16 Apr-16 May-16 0.00 2.00 4.00 6.00 8.00 10.00 12.00 14.00 16.00 [TP] @ PE (mg/L)
P Recovery ry
P Recovery Process Principle of Operation • Use of centrate and P-rich streams in WWTPs as feed • Streams pumped upward through the bottom of the reactor • Supersaturation conditions as driving force • Inject NaOH to raise pH to 7.7 • Inject MgCl2 at a molar ratio of 1.1:1 (Mg:P) • Spontaneous crystal nucleation occurs • Deposition on surface of crystals occurs as chemical driving force reduces • Crystals grow through this precipitation • Pellets recycled for further growth Recovered Product • High purity struvite (99.5% struvite) • Composed of Phosphorus, Nitrogen, and Magnesium MgNH 4 PO 4 •6H 2 O • Utilized as a slow release fertilizer – 5-28-0+10% • Enhanced efficiency fertilizer • Reduces risk of nutrient run-off
P Recovery at SWRP Construction Dates • Startup of Facility: 5/2016 Anoxic/ • Operations test ongoing Primary Aerobic Clarifiers Anaerobic Description of SWRP Facility • 3 Pearl 10,000 reactors at SWRP Ferment- • Sized to accept both post-digestion centrate and ation pre-digestion centrate (from WASSTRIP) Thickening WASSTRIP • Estimated concentrations of orthoP in these streams: • Post-digestion Centrate: 50 – 200 mg/L Pearl • WASSTRIPATE: 58 – 75 mg/L Process Thickening (avg & max from benchscale experiments) (High P and Mg, low NH 3 ) Based on loading to facility, estimated production: • With post-digestion centrifuge alone: Anaerobic Dewatering 2,200 tons/year fertilizer Digestion • With post-digestion centrifuge + WASSTRIPATE 7,700 – 9,600 tons/year fertilizer
Pearl Reactors Crystal Green Dewatering Storage & Screen & Bagging Dryer
Pounds of f ort rthoP Removed Daily fr from Post-Digestion Centrate 4500 • Average: 1,800 lb/day 4000 • Represents ~10% of the orthoP load 3500 orthoP Removed (lbs/d) 3000 2500 2000 1500 1000 500 0
Stickney EBPR Progress – Monthly Means Stickney Plant Effluent TP Primary Effluent TP 1.80 18.00 PE TP: 4.7 mg/L PE TP: 7.6 mg/L PE TP: 7.5 mg/L Outfall TP: 0.86 mg/L Outfall TP: Outfall TP: 1.16 mg/L 1.60 16.00 2017 – 0.64 mg/L 2018 – 0.30 mg/L 1.40 14.00 [TP] @ Outfall, Battery D (mg/L) 1.20 12.00 [TP] @ PE (mg/L) 1.00 10.00 0.80 8.00 0.60 6.00 0.40 4.00 0.20 2.00 0.00 0.00
Chall llenges
Seed In Injector System
Cit itric Acid System Ext xtension
Sulfu furic Acid System
Chemicals Chemical Usage Titration 1 16000 2 1.5 14000 Base [mL] 1 12000 0.5 10000 0 Gallons/Week 6.6 6.8 7 7.2 7.4 7.6 7.8 pH 8000 6000 4000 2000 0 7/19 7/29 8/8 8/18 8/28 9/7 9/17 9/27 10/7 10/17 10/27 NaOH MgCl2
Questions? Y. . Mwende Lefle ler le lefl flery ry@mwrd.org
Recommend
More recommend