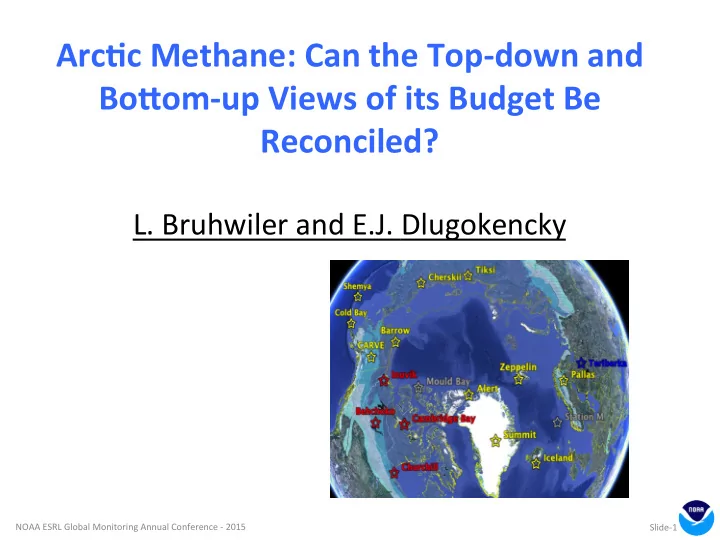

Arc$c ¡Methane: ¡Can ¡the ¡Top-‑down ¡and ¡ Bo5om-‑up ¡Views ¡of ¡its ¡Budget ¡Be ¡ Reconciled? ¡ ¡ L. ¡Bruhwiler ¡and ¡E.J. ¡Dlugokencky ¡ ¡ ¡ NOAA ¡ESRL ¡Global ¡Monitoring ¡Annual ¡Conference ¡-‑ ¡2015 ¡ Slide-‑1 ¡
We ¡Need ¡to ¡Understand ¡the ¡Arc$c ¡Carbon ¡Budget ¡ • Orbital ¡Forcing ¡and ¡Permafrost ¡Carbon ¡Feedbacks ¡may ¡explain ¡ hyperthermal ¡events ¡~55Mya ¡ ¡ • Global ¡T ¡increase ¡of ¡5 ¡ C ¡within ¡a ¡few ¡1000 ¡years ¡(Today ¡0.6 ¡C/10yrs!) ¡ ¡ • ~3700 ¡PgC ¡in ¡Eocene ¡permafrost ¡(~1700 ¡PgC ¡today) ¡ ¡ ¡ ¡ ¡ ¡ ¡ ¡(DeConto ¡et ¡al. ¡Nature ¡2012) ¡ ¡ • Enough ¡carbon ¡could ¡thaw ¡by ¡2100 ¡to ¡ ¡ ¡ ¡ ¡ ¡ ¡raise ¡atmospheric ¡CO 2 ¡by ¡100-‑180 ¡ppm ¡ ¡ ¡ ¡ ¡ ¡(Harden ¡et ¡al.,2012). ¡ ¡ ¡ A ¡coryphodon ¡ basking ¡in ¡the ¡ warm ¡eocene ¡ NOAA ¡ESRL ¡Global ¡Monitoring ¡Annual ¡Conference ¡-‑ ¡2015 ¡ Slide-‑2 ¡
The ¡Bo5om-‑Up ¡View ¡ NOAA ¡ESRL ¡Global ¡Monitoring ¡Annual ¡Conference ¡-‑ ¡2015 ¡ Slide-‑3 ¡
Process ¡ TgCH 4 /yr ¡ Reference ¡ Arc$c ¡Tundra ¡Wetlands ¡ 26 ¡(15 ¡to ¡68) ¡ ¡ McGuire ¡et ¡al.,,2012 ¡ ¡ High ¡Northern ¡Lakes ¡ 17 ¡( ¡±10) ¡ Vik ¡et ¡al., ¡2014, ¡submi\ed ¡ (Glacial/Post-‑Glacial, ¡Thermokarst, ¡ Peatland ¡Ponds, ¡Beaver ¡Ponds) ¡ “Anomalous ¡Hydrates” ¡in ¡Laptev ¡ 17 ¡ ¡ Shakhova ¡et ¡al., ¡2013 ¡ Sea ¡Sediments ¡ Autumn ¡“Freeze-‑out” ¡Emissions ¡ 4 ¡ Mastepanov ¡et ¡al., ¡2008 ¡ ¡ Total ¡Budget ¡of ¡Arc$c ¡CH 4 : ¡ ¡ ¡ ¡ ¡ ¡ ¡64 ¡(43 ¡– ¡99) ¡TgCH 4 /yr ¡ NOAA ¡ESRL ¡Global ¡Monitoring ¡Annual ¡Conference ¡-‑ ¡2015 ¡ Page ¡-‑4 ¡
The ¡Top-‑Down ¡View ¡ Growth ¡Rate ¡Anomalies ¡ Courtesy ¡of ¡E. ¡Dlugok ¡ NOAA ¡ESRL ¡Global ¡Monitoring ¡Annual ¡Conference ¡-‑ ¡2015 ¡ Page-‑5 ¡
Prior ¡Emission ¡Es]mates ¡ Remotely ¡Sensed ¡ Ecological ¡Data ¡ Atmospheric State (Concentration and Emissions) Satellites, TCCON Earth Analyzer - CH 4 (Column Data) Current Surface Network Earth Networks (Planned) NOAA ¡ESRL ¡Global ¡Monitoring ¡Annual ¡Conference ¡-‑ ¡2015 ¡
Source ¡ Tg ¡CH 4 ¡yr -‑1 ¡ ¡ 15.5 ¡(11.1-‑27.4) ¡ Wetlands ¡ • 0.6 ¡(0.4-‑1.0) ¡ • Biomass ¡Burning ¡ 9.3 ¡(7.2-‑10.5) ¡ Anthropogenic ¡ • Total ¡Budget ¡of ¡Arc$c ¡CH 4 : ¡ ¡ ¡ ¡25 ¡(18 ¡– ¡29) ¡TgCH 4 /yr ¡ Atmospheric ¡Inversions ¡ NOAA ¡ESRL ¡Global ¡Monitoring ¡Annual ¡Conference ¡-‑ ¡2015 ¡ Page ¡7 ¡
Do ¡Inversions ¡ Agree ¡on ¡IAV? ¡ ¡ Are ¡There ¡ Emission ¡Trends ¡? ¡ NOAA ¡ESRL ¡Global ¡Monitoring ¡Annual ¡Conference ¡-‑ ¡2015 ¡ Page ¡-‑8 ¡
Why ¡Do ¡Top-‑Down ¡and ¡Bo5om-‑Up ¡Approaches ¡ Disagree? ¡ • Transport ¡Biases ¡in ¡Inversions ¡ • Difficult ¡to ¡Use ¡Con$nental ¡Sites ¡ • Models ¡may ¡be ¡Biased ¡Towards ¡Stability ¡ ¡ 1975 1975 Station Churchill 1950 1950 Behchoko Alert Inuvik Cambridge Bay 1925 1925 Methane (ppb) 1900 1900 1875 1875 1850 1850 1825 1825 1800 1800 2007 2008 2009 2010 2011 2012 2013 Year Data ¡from ¡D ¡Worthy, ¡Environment ¡Canada ¡ NOAA ¡ESRL ¡Global ¡Monitoring ¡Annual ¡Conference ¡-‑ ¡2015 ¡ Page ¡-‑9 ¡
The ¡$60 ¡Trillion ¡Paper: ¡ ¡ Nature, ¡July ¡2013 ¡ ¡ The ¡Scenario: ¡ ¡A ¡50 ¡Gt ¡Reservoir ¡ ¡ of ¡CH 4 ¡destabilizes! ¡ NOAA ¡ESRL ¡Global ¡Monitoring ¡Annual ¡Conference ¡-‑ ¡2015 ¡ Page ¡10 ¡
A ¡Possible ¡Way ¡Forward: ¡ The ¡FIM-‑grid ¡ 1) Increase ¡spa]al ¡resolu]on ¡of ¡ atmospheric ¡transport ¡ simula]ons ¡used ¡in ¡ inversions. ¡ 2) ¡ Scale-‑up ¡chamber/flux ¡ measurements ¡using ¡ progressively ¡lower ¡resolu]on ¡ land ¡surface ¡classifica]on ¡from ¡ remote ¡sensing ¡plaborms. ¡ (NSF ¡MacroSystems ¡Biology ¡ Project, ¡Varner, ¡UNH, ¡PI ¡ NOAA ¡ESRL ¡Global ¡Monitoring ¡Annual ¡Conference ¡-‑ ¡2015 ¡ Page ¡-‑11 ¡
Recommend
More recommend