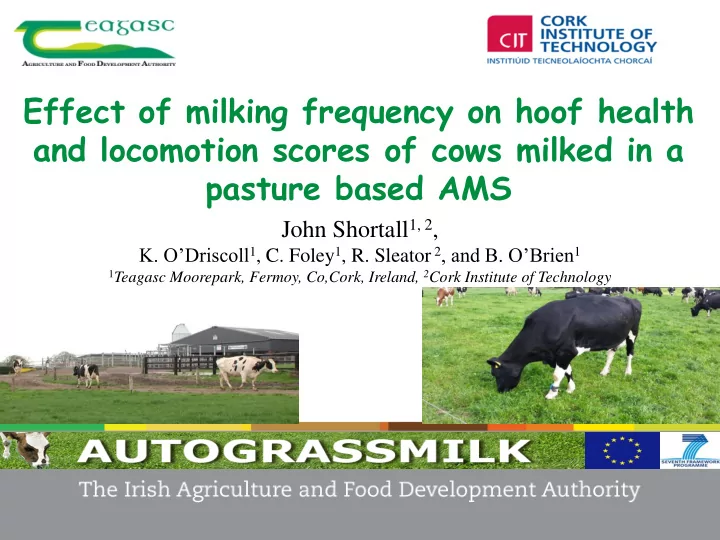

Effect of milking frequency on hoof health and locomotion scores of cows milked in a pasture based AMS John Shortall 1, 2 , K. O’Driscoll 1 , C. Foley 1 , R. Sleator 2 , and B. O’Brien 1 1 Teagasc Moorepark, Fermoy, Co,Cork, Ireland, 2 Cork Institute of Technology
Introduction • Lameness • Painful and debilitating condition • One of most important welfare issues for dairy cattle • Costs associated with lameness • Reduced milk yield • Treatment • Increased risk of culling • Lower survival rate within herd
Introduction • Successful operation of AMS requires cows to present at robot for milking on voluntary basis • Effect of lameness on AMS • visits to AMS (Miguel-Pacheco et al., 2013) • milk production (Bach et al., 2006) • increased labour – fetching lame cows • efficiency of system
Introduction • Milking frequency and lameness • CM pasture based systems • OAD milking vs TAD milking ( O’Driscoll et al., 2009) • No adverse effect of OAD milking • Reduced sole bruising /lesions • Less time on roadways and holding yards
Hypothesis Investigate the effect of reducing milking frequency on hoof health and locomotion scores of cows milked in a pasture based AMS
Materials and Methods
Materials and Methods • Cows were randomised into two groups balanced for: • Breed, • Parity, • Days in milk, • Previous 25 days milk production and milking frequency Group 1 Group 2 n = 34 n = 34 Milking permission 2 Milking permission 3 times per day times per day
Materials and Methods • Treatments were imposed from 60 – 160 DIM • Diet • Grazed grass (17kg DM/cow/day) • Concentrate (0.8kg DM/cow/day) • Grazing • Pre grazing herbage mass 1600kg DM/ha • Post grazing sward height 5cm
Farm Layout Section B Section A 8 hours 8 hours Section C 8 hours AMS 3-Way Grazing (ABC) System
Hoof Scores • Subsample: 41 cows • Cows scored on 3 occasions • 44, 85, 167 DIM • Scored by lifting hind feet • Each claw examined individually
Hoof Health Scoring System Scale Heel erosion • 5 1 Dermatitis • 1 5 White line disease • 1 4 Sole bruising • 1 8
Locomotion Scores • 67 cows scored • Cows scored on 3 occasions • 64, 85, 113 DIM • Level, clean, concrete surface Observed from side • and behind
Locomotion Scoring System Spine Curvature • Speed • Scale Tracking • 1 5 Head Carriage • Ab/Aduction •
Statistical Analysis Hoof scores • • Proc Mixed in SAS • Locomotion scores • Proc Glimmix in SAS • Fixed effects • Milking frequency, breed, parity, DIM, exam and interactions • Exam included as random or repeated effect • Initial exam included as covariate
Results
Results – Milk Production & Cow Traffic G1 G2 p value Milking Frequency/Day 1.5 1.8 <0.0001 Milking Interval/Visit 15.1 12.6 <0.0001 Milk Yield/Visit (kg) 12.7 10.4 <0.0001 Milk Yield/Day (kg) 18.4 19 NS Milk Duration/Visit (mins) 7.3 6.6 <0.0001 Milk Duration/Day (mins) 10.7 12.3 <0.0001 Return Time/Visit (hours) 4.3 5 0.001 Wait Time/Day (hours) 1.8 2.5 <0.001
Results Clinical Lameness • Based on farm managers assessment • Cow had to require treatment • 10/68 cows (14%) clinically lame once • 3/10 cows (30%) clinically lame > once • Activity • G1 – 5% > than G2 •
Results – Hoof Health G1 G2 P-value Exam 1 2 3 1 2 3 Trt. Exam Trt*Ex Heel Erosion 4.4 3.7 4.2 5.2 3.7 4.7 NS NS NS Dermatitis 0.9 1.2 1.2 1.0 1.3 1.4 NS NS NS White Line 2.1 1.9 1.3 2.2 2.4 1.8 NS NS NS Disease Sole Bruising 3.6 4.6 1.8 3.6 3.3 1.8 NS 0.001 NS
Results - Locomotion G1 G2 P-value Exam 1 2 3 1 2 3 Trt. Exam Trt*Ex Spine Curvature 1.9 1.8 1.6 1.9 1.6 1.5 NS 0.001 0.001 Speed 1.3 1.1 1.0 1.3 1.2 1.3 NS 0.001 0.001 Tracking 2.3 1.9 1.7 2.1 1.9 1.8 NS NS NS Head Carriage 1.5 1.4 1.1 1.6 1.4 1.2 NS 0.001 NS Abduction/ 1.9 1.7 1.8 1.7 1.7 1.8 NS 0.05 NS Adduction Total 8.6 7.7 7.1 8.6 8 7.7 NS 0.05 NS Locomotion
Results - Locomotion G1 G2 P-value Exam 1 2 3 1 2 3 Trt. Exam Trt*Ex Spine Curvature 1.9 1.8 1.6 1.9 1.6 1.5 NS 0.001 0.001 Speed 1.3 1.1 1.0 1.3 1.2 1.3 NS 0.001 0.001 Tracking 2.3 1.9 1.7 2.1 1.9 1.8 NS NS NS Head Carriage 1.5 1.4 1.1 1.6 1.4 1.2 NS 0.001 NS Abduction/ 1.9 1.7 1.8 1.7 1.7 1.8 NS 0.05 NS Adduction Total 8.6 7.7 7.1 8.6 8 7.7 NS 0.05 NS Locomotion
Conclusions
Conclusions Reducing milking frequency • No significant effect • Up to 160 days in milk • Exam had a significant effect • 5/6 aspects of locomotion & bruising • Reduced waiting time for G1 cows • Showed no benefit for sole bruising • G1 cows had > activity level than G2 •
We wish to acknowledge our funding partners Thank you
Recommend
More recommend