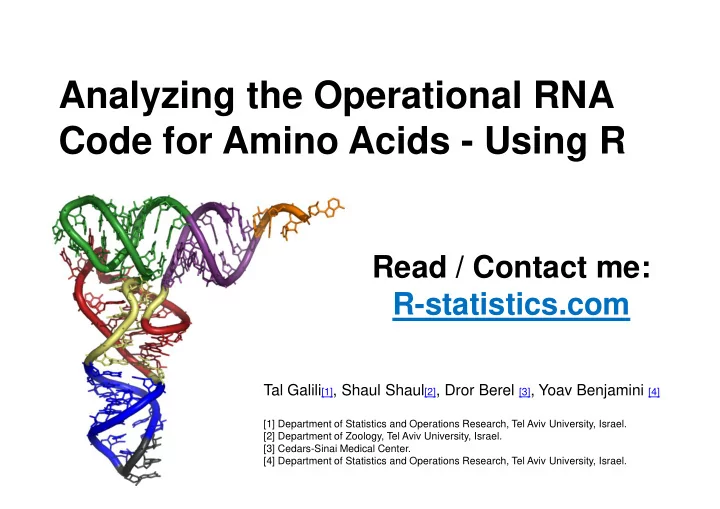

Analyzing the Operational RNA Code for Amino Acids - Using R Read / Contact me: Read / Contact me: R-statistics.com Tal Galili [1] , Shaul Shaul [2] , Dror Berel [3] , Yoav Benjamini [4] [1] Department of Statistics and Operations Research, Tel Aviv University, Israel. [2] Department of Zoology, Tel Aviv University, Israel. [3] Cedars-Sinai Medical Center. [4] Department of Statistics and Operations Research, Tel Aviv University, Israel.
Story
ATP
�
Data
Data source
55 Archaea ���� tRNA sequences
55 Archaea ���� tRNA sequences
Visualize
2342 2342 Data rows
Mosaic plot: nucleotide distribution in tRNA acceptor stem
Sequence logo plot (Schneider and Stephens - 1990)
Title ? Colors? Colors? X labels?
-> “grid“ graphics….
Title ? Colors? Colors? X labels?
Codon distribution, per location, per Amino Acid
Analyze
CART (Classification and regression trees) • Goal predict target variable • Method : recursively partition explanatory variables
CART ( Classification and regression trees ) ����������������������������������������������������������������� ��������������������������������������������������������������� ������������� ����������������������!"����� -- “ The Blind Men and the Elephant ” by John Godfrey Saxe (1816-1887)
CART with default values Library(rpart)
CART Predictive success ? (use.n = T)
CART Percent of success in prediction Red = bellow 60% fit
Cross validation – Relative error
Cross validation – Misclassification rate
Bigger tree?
Bigger tree?
Cross validation – Misclassification rate
Relative importance for each letter in the model (Sum of information gain in the use of each letter in the model)
Relative importance for each letter in the model
Results •20% misclassification in prediction •Same acceptor stem RNA can code for for different Amino Acids •In different Archaeas •In the same Archaea Conclusions Conclusions •There is code in the acceptor stem •It is not enough
Thank you ! Read / Contact me: Read / Contact me: R-statistics.com Tal Galili [1] , Shaul Shaul [2] , Yoav Benjamini [3] , Dror Berel [4] [1] Department of Statistics and Operations Research, Tel Aviv University, Israel. [2] Department of Zoology, Tel Aviv University, Israel. [3] Department of Statistics and Operations Research, Tel Aviv University, Israel. [4] Cedars-Sinai Medical Center.
Recommend
More recommend