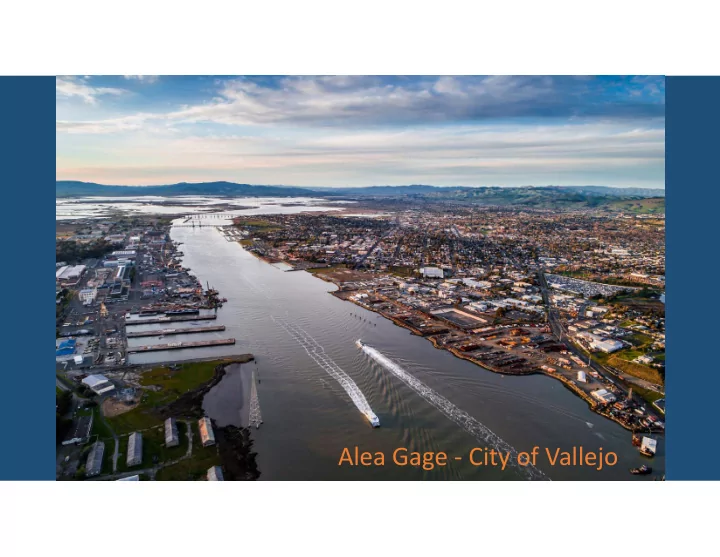

Alea Gage ‐ City of Vallejo
Vallejo’s Enduring Diversity Latinx White 27% 26% Black Asian 22% 25% Source: ABAG Diversity Rankings (1/2019) from 2017 American Community Survey
The Vallejo Amalgam Local Economic Environment: • Median Household Income $62,272 (SF/SM/Marin MSA $118,400) • 5% population growth since 2010 without significant new construction • Top 5 housing market in the US 2016‐2018 • 1.2m ferry riders/year – 97% occupancy Accomplishments: • Majority‐minority Council since 2013 • Six Census tracts designated as Opportunity Zones in 2018 • Investments in public services and preparing for development
Recent Significant Events 1996 Mare Island Naval Shipyard closes 2008‐2011 Bankruptcy 2011/2016 Measure B/V (1% sales tax) 2017 Propel Vallejo: General Plan 2040
Bringing investment & equitable development Biggest challenges: Biggest opportunities: • • Perception of public safety Capacity on Mare Island for • School quality innovation & jobs • • Aging infrastructure Ferry expansion & TOD at • Need to strengthen civil/ downtown & waterfront sites • social service sector Housing affordability • • Low tax base Location & infrastructure capacity • • High development costs Skilled & available workforce • without high values Six Opportunity Zone • Liabilities (including pensions) designations
Downtown/Waterfront Mare Island
Questions • Are we preparing for pressures accompanying potential growth? • How can Vallejo garner its share of regional prosperity? How do we weather market cycles when revitalization is a long‐term proposition? • How can the Participatory Budgeting model change the way we make decisions? • While it’s necessary to focus on revenue generation, how we can envision community stability differently and in greater partnership?
Recommend
More recommend