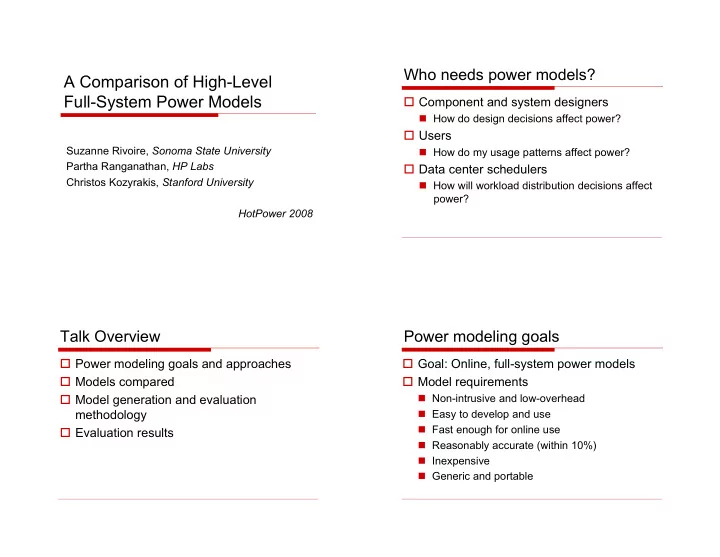

Who needs power models? A Comparison of High-Level Full-System Power Models � � Component and system designers � � How do design decisions affect power? � � Users Suzanne Rivoire, Sonoma State University � � How do my usage patterns affect power? Partha Ranganathan, HP Labs � � Data center schedulers Christos Kozyrakis, Stanford University � � How will workload distribution decisions affect power? HotPower 2008 Talk Overview Power modeling goals � � Power modeling goals and approaches � � Goal: Online, full-system power models � � Models compared � � Model requirements � � Model generation and evaluation � � Non-intrusive and low-overhead methodology � � Easy to develop and use � � Fast enough for online use � � Evaluation results � � Reasonably accurate (within 10%) � � Inexpensive � � Generic and portable
Power modeling approaches High-level models (Mantis) � � Detailed component models Output: Input: � � Simulation-based Equation Predicted power Common util. � � Hardware metric-based (system) metrics � � High-level full-system models � � How accurate? � � How portable? � � Tradeoff between model parameters/complexity and accuracy? Power Modeling Models studied P = C 0 � � Run one-time calibration scheme � � Constant power (the null model): (possibly at vendor) � � Stress individual components: CPU, memory, disk � � CPU utilization-based models � � Outputs: time-stamped performance metrics & AC power measurements � � Fit model parameters to calibration Output: Input: data Equation Predicted power CPU util. % � � Use model to predict power (system) � � Inputs: performance metrics at each time t � � Output: estimation of AC power at each time t
CPU utilization-based models CPU + disk utilization � � Linear in CPU utilization Input: Output: Equation P = C 0 + C 1 u - � CPU util. % Predicted power - Disk util. % (system) � � Empirical power model P = C 0 + C 1 u CPU + C 2 u disk 1 u + C 2 u r P = C 0 + C [Fan et al, ISCA 2007] [Heath et al, PPoPP 2005] CPU + disk util. + performance ctrs CPU performance counters � � Configurable processor registers to count Input: Output: microarchitectural events Equation - � CPU util. % Predicted power � � In this study: - Disk util. % (system) - � CPU perfctrs � � Memory bus transactions � � Unhalted CPU clock cycles P = C 0 + C 1 u CPU + C 2 u disk + � C i P � � Instructions retired/ILP i � � Last-level cache references � � Floating-point instructions [D. Economou, S. Rivoire, C. Kozyrakis, P. Ranganathan, MoBS 2006]
Evaluation methodology Evaluation machines � � Run calibration suite and develop models � � Mobile fileserver with 1 and 13 disks on a variety of machines � � Highest and lowest frequencies � � 2005-era AMD laptop � � Run benchmarks, collecting metrics and � � Highest and lowest frequencies AC power � � 2005-era Itanium server � � 2008-era Xeon server with 32 GB FBDIMM � � Compare predicted power from metrics � � Variety in component balance, processor, with measured AC power domain, dynamic range Overall mean % error Evaluation benchmarks � � SPECcpu int and fp � � Laptop: gcc and gromacs only � � SPECjbb � � Stream � � I/O-intensive programs � � ClamAV � � Nsort (mobile fileserver only) � � SPECweb (Itanium only)
Overall mean % error Overall mean % error Any model is more accurate than none, and Any model is more accurate than none, and more detail/complexity is better than less. more detail/complexity is better than less. Performance counter model is most accurate across the board. Best case for empirical CPU model Overall mean % error (Xeon server) Any model is more accurate than none, and more detail/complexity is better than less. Performance counter model is most accurate across the board. Simple linear CPU-util. model gets within 10% …with some exceptions.
Best case for empirical CPU model Best case for performance counters (Xeon server) (Xeon server and mobile fileserver-13) Useful to model shared resources and bottlenecks Best case for performance counters Best case for performance counters (Xeon server and mobile fileserver-13) (Xeon server and mobile fileserver-13) Necessary when dynamic memory power is high Necessary when dynamic memory power is high Useful to tell how CPU is being utilized
Future work Conclusions � � Beyond CPU, memory, and disk � � Generic approach to power modeling yields accurate results � � GPUs � � Simple models overall have < 10% error � � Network (not a factor today) � � Same parameters across very different machines � � Model complexity � � More information � better models � � Combine exponential CPU model w/ perfctrs? � � Linear CPU util. model not enough for… � � Cooling – fan power is cubic function of speed � � Machines and workloads that are not CPU-dominated � � CPUs with shared resource bottlenecks � � Aggressively power-optimized CPUs � � …all of which reflect hardware trends.
Recommend
More recommend