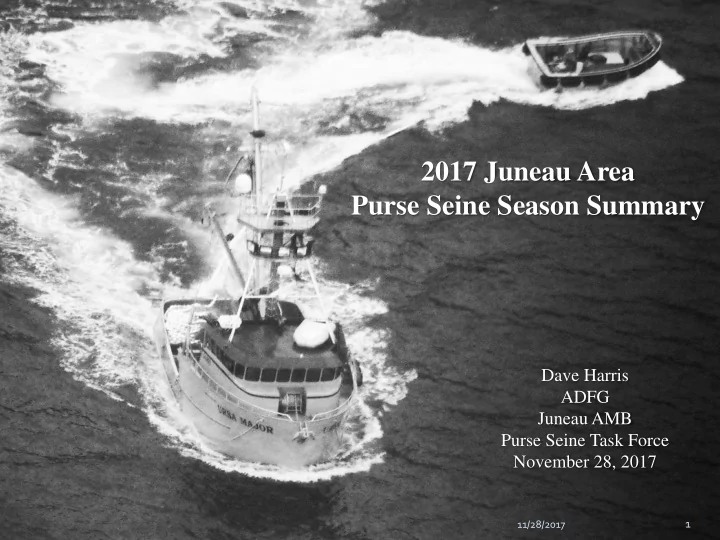

2017 Juneau Area Purse Seine Season Summary Dave Harris ADFG Juneau AMB Purse Seine Task Force November 28, 2017 1 11/28/2017
2017 Juneau Management Area Common Property Purse Seine Salmon Harvests and Averages Escapements met or exceeded in six of ten pink salmon stock groups Pink salmon harvests above 10-year average; 5 th highest since 1960 Chum salmon harvests above 10-year average; 3 rd highest since 1960 Incidental sockeye harvest above 10-year average king sockeye coho pink chum total 2017 770 89,500 111,400 11,071,000 1,238,000 12,510,000 10-yr average 350 48,300 32,300 6,255,500 484,500 6,821,000 % 10-yr 230% 185% 342% 177% 255% 183% odd-yr average 530 82,400 47,200 11,403,500 595,200 12,129,000 % odd-yr 146% 108% 234% 97% 208% 103% 2 11/28/2017
3 11/28/2017
Northern Southeast Inside Pink Salmon Migration Routes Based on tagging investigations 1977-1980 4 11/28/2017
Northern Southeast Inside Pink Salmon Migration Routes Based on tagging investigations 1977-1980 Early Run Late June to mid-July 5 11/28/2017
Northern Southeast Inside Pink Salmon Migration Routes Based on tagging investigations 1977-1980 Middle Run Late July 6 11/28/2017
Northern Southeast Inside Pink Salmon Migration Routes Based on tagging investigations 1977-1980 Late Run August 7 11/28/2017
8 11/28/2017
Subsistence Pacific Salmon Treaty Transboundary River Directed Harvest Sharing with Gillnet Canada Sport, Tourism Subsistence Directed Gillnet Subsistence 9 11/28/2017
Hawk Inlet Shoreline 15,000 wild sockeye harvest limit in July, including Amalga Harbor SHA 10 11/28/2017
Hawk Inlet Test Fisheries July 7, 2017 SW 27 June 30, 2017 SW 26 2017 10-Year Average 2017 10-Year Average 10,000 10,000 8,000 8,000 Number of Fish Number of Fish 6,000 6,000 4,000 4,000 2,000 2,000 0 0 King Sockeye Coho Pink Chum King Sockeye Coho Pink Chum 2017 4 64 6 1,267 4,225 2017 5 331 115 10,323 4,545 10-Year Average 8 252 5 471 1,564 10-Year Average 4 219 19 1,450 1,958 July 21, 2017 SW 29 July 14, 2017 SW 28 2017 10-Year Average 2017 10-Year Average 10,000 10,000 8,000 Number of Fish 8,000 Number of Fish 6,000 6,000 4,000 4,000 2,000 2,000 0 0 King Sockeye Coho Pink Chum King Sockeye Coho Pink Chum 2017 0 94 52 4,843 702 2017 0 630 158 10,065 3,185 10-Year Average 1 212 19 2,660 1,629 10-Year Average 2 345 25 3,199 1,530 11 11/28/2017
Fishery date hours boats sockeye pink chum Amalga SHA 7/6 6 77 740 20,153 123,683 Hawk Inlet 7/9 8 67 2,652 173,821 22,962 Amalga SHA 7/13 6 71 778 29,374 187,161 Hawk Inlet 7/16 8 36 2,689 269,566 13,517 Amalga SHA 7/20 6 30 558 1,132 121,979 Hawk Inlet 7/23 8 33 6,081 359,483 15,845 Hawk Inlet 7/27 8 21 6,369 211,140 17,033 Amalga SHA 7/27 reduced area open, sockeye harvests do not apply 19,867 1,064,669 502,180 wild sockeye: 14,186 enhanced sockeye: 5,681 12 11/28/2017
13 11/28/2017
Amalga Harbor SHA common property Amalga Harbor SHA: purse seine; full and reduced area full and reduced area 2012 - 2016 2012 - 2016 14 11/28/2017
2017 Amalga Harbor SHA: Extended South Line Eagle Harbor 15 11/28/2017
2017 Amalga Harbor SHA Seine Fisheries 2017 Amalga Harbor SHA: Extended South Line Eagle Harbor SW king sockeye coho pink chum boats 27 74 740 62 20,153 123,683 78 28 4 778 119 29,374 187,161 68 29 14 558 95 11,342 121,979 29 30 11 613 278 18,521 80,866 19 103 2,689 554 79,390 513,689 99 year king sockeye coho pink chum boats 2012 32 4,015 137 4,677 411,397 96 2013 144 4,429 162 33,557 1,081,913 105 2014 28 1,440 132 860 227,048 101 2015 18 912 208 41,731 222,594 57 2016 49 2,684 130 2,367 252,496 44 2017 103 2,689 554 79,390 513,689 99 16 11/28/2017
Juneau Management Area: Pink Salmon Escapement by Stock Group 2013-2017 Stock Group Target Range Escapement Index 2013 2014 2015 2016 2017 Freshwater Bay 80,000 - 180,000 67,850 20,080 62,850 36,061 63,150 Homeshore 30,000 - 70,000 82,756 4,216 98,188 1,600 22,795 Lower Lynn Canal 20,000 - 60,000 38,800 51,300 1,786 154,306 4,493 Upper Lynn Canal 30,000 - 70,000 86,049 2,436 254,757 4,029 80,935 N Chichagof 120,000 - 280,000 398,900 16,640 325,663 25,852 337,920 Seymour Canal 160,000 - 400,000 221,225 51,470 248,620 63,020 110,030 Stephens 110,000 - 250,000 95,350 28,273 178,551 13,751 179,464 SW Admiralty 100,000 - 250,000 236,460 33,344 262,157 39,755 346,273 Tenakee 210,000 - 510,000 442,003 102,820 398,574 99,865 432,683 West Admiralty 50,000 - 120,000 153,225 5,224 49,804 8,905 31,700 Bold numbers in red font are below management target range; underlined are above management target range 17 11/28/2017
2018 Expectations: 2016 pink salmon escapements below targets for all Juneau Management Area stock groups; 3 rd lowest aggregate index since Statehood. Initial Point Augusta Index Area Opening June 17. Amalga Harbor SHA openings in July, depending on run strength. 11/28/2017 18
Recommend
More recommend