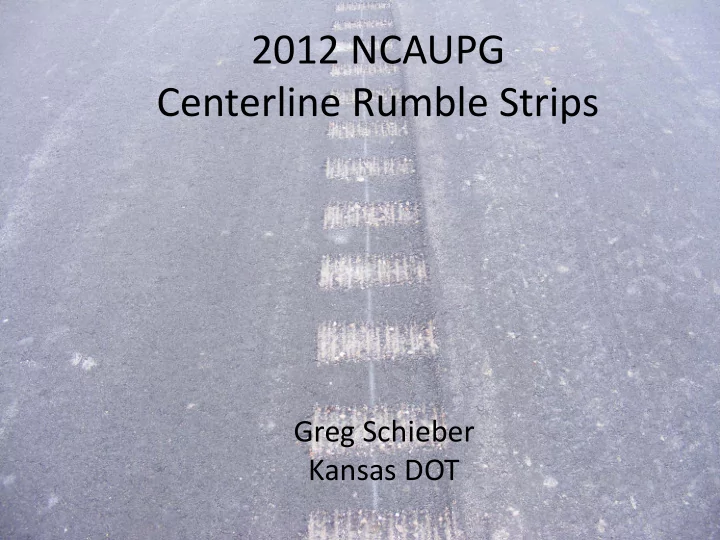

2012 NCAUPG Centerline Rumble Strips Greg Schieber Kansas DOT
History • 1999 – KDOT started looking at Centerline Rumble Strips • K-State University has completed several research reports – Dr. Eugene Russell • K-State University Completed Phone Survey – No standards for type and dimensions • Proposed Test Section
1999 Test Section • 12 Test Patterns • Three Different Patterns – Continuous 12” on Center – Continuous 24” on Center – Alternating 12 & 14” on Center • Four Widths – 5, 8, 12, and 16” • Depth – 0.5” • Evaluate dB and steering wheel vibration level
1999 Test Section
1999 Test Section • Seven Vehicles – left wheel on rumble strip – Two Dump Trucks – Full-size truck – Full-size passenger car – Compact passenger car – Minivan – SUV • 60 mph • Recorded decibel at ear level of driver • Recorded vibrations on steering wheel
1999 Test Section 12” continuous 12” and 24” alternating 24” continuous
1999 Test Section 12” continuous 12” and 24” alternating 24” continuous
1999 Test Section • Conclusions – Continuous 12” • Highest dB levels • 2 nd highest vibration – Alternating 12” and 24” • 2 nd Highest dB levels • Highest vibration • Field test – 12” long, continuous 12” center – 12” long, alternating 12” and 24”
First Field Section • 14 mile stretch on US-50 – 7 miles continuous 12” – 7 miles alternating 12” and 24” • Constructed June 2003
First Field Section
First Field Section
Public Survey • 36% felt both patterns were loud enough • 34% felt continuous was louder • 34% felt both patterns had good vibration • 36% felt continuous pattern had better vibration • 38% recommended continous • 96% felt they would reduce accidents
Current Policy • Issued July 2007 – HMA Pavements Only – Two-lane Rural Highways • Class B • Class C – District Engineer
Current Policy • Since Fall of 2007 – 130 projects – Approximately 1,350 miles of rumble strips • One Bid Item by Station – Cost – average $16 per STA – Varies range $4 to $48
Accident Study • US-50 – Rectangular section, 12’ – Before period – January 1998 to June 2003 – After period – July 2003 to December 2007 • US-40 – Football shaped section, 12’ – Before period – January 1998 to May 2005 – After period – June 2005 to December 2007
Accident Study
Accident Study
Total Accidents Total Accidents 150 146 145 145 140 138 135 130 125 120 116 115 112 110 105 100 100 95 90 3rd Yr Before 2nd Yr Before 1st Yr Before 1st Yr After 2nd Yr After 3rd Yr After
Total Accidents Fatality Accidents 12 10 10 10 8 7 6 6 6 4 4 2 0 3rd Yr Before 2nd Yr Before 1st Yr Before 1st Yr After 2nd Yr After 3rd Yr After
Total Accidents Injury Accidents 70 66 65 60 55 52 50 50 46 45 43 40 34 35 30 25 20 3rd Yr Before 2nd Yr Before 1st Yr Before 1st Yr After 2nd Yr After 3rd Yr After
Total Accidents Property Damage Only 90 86 85 80 78 75 70 70 67 65 62 60 60 55 50 3rd Yr Before 2nd Yr Before 1st Yr Before 1st Yr After 2nd Yr After 3rd Yr After
Questions ?
Recommend
More recommend