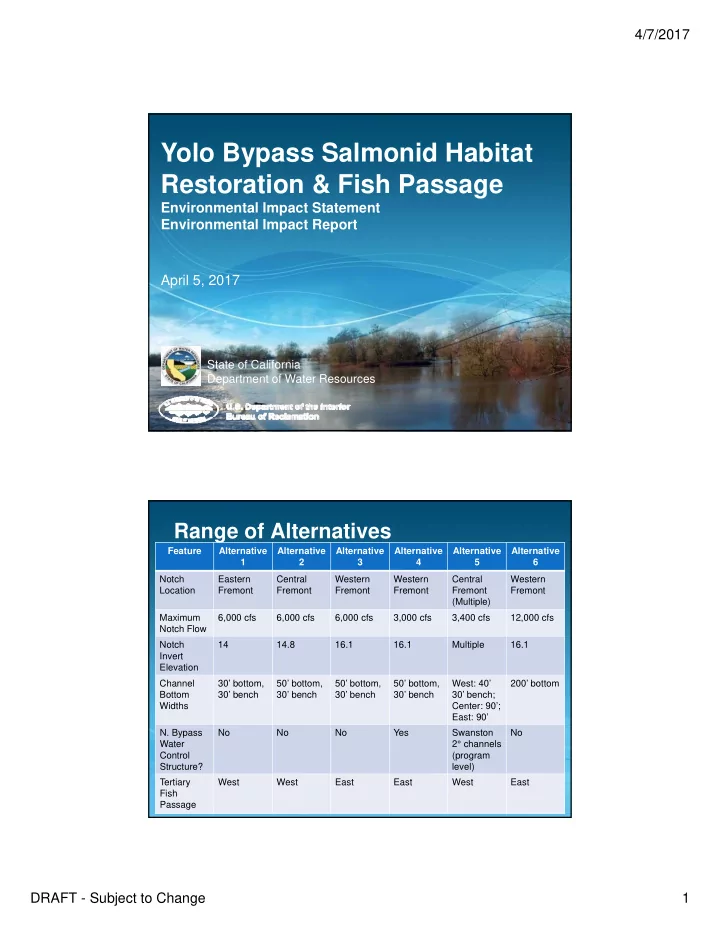

4/7/2017 Yolo Bypass Salmonid Habitat Restoration & Fish Passage Environmental Impact Statement Environmental Impact Report April 5, 2017 State of California Department of Water Resources 1 Range of Alternatives Feature Alternative Alternative Alternative Alternative Alternative Alternative 1 2 3 4 5 6 Notch Eastern Central Western Western Central Western Location Fremont Fremont Fremont Fremont Fremont Fremont (Multiple) Maximum 6,000 cfs 6,000 cfs 6,000 cfs 3,000 cfs 3,400 cfs 12,000 cfs Notch Flow Notch 14 14.8 16.1 16.1 Multiple 16.1 Invert Elevation Channel 30’ bottom, 50’ bottom, 50’ bottom, 50’ bottom, West: 40’ 200’ bottom Bottom 30’ bench 30’ bench 30’ bench 30’ bench 30’ bench; 2 yxwvutsrqponmlkihgfedcbaYUTSRQPONMLIHGFEDCBA Widths Center: 90’; East: 90’ N. Bypass No No No Yes Swanston No Water 2° channels Control (program Structure? level) Tertiary West West East East West East Fish Passage DRAFT Subject to Change 1
4/7/2017 Air Quality Calculations • Construction emissions calculated based on schedules, equipment, and construction worker estimates • Estimated constituents of concern Reactive organic gas (ROG) – Nitrogen oxides (NOx) – Carbon monoxide (CO) – Sulfur dioxide (SO 2 ) – Inhalable particulate matter (PM10) – Fine particulate matter (PM2.5) – • Compare to thresholds 3 Air Quality Thresholds – yxwvutsrqponmlkihgfedcbaYUTSRQPONMLIHGFEDCBA • CEQA standards Yolo-Solano AQMD significance thresholds – Feather River AQMD significance thresholds – • Clean Air Act General Conformity evaluation Lead agency required to demonstrate that proposed action conforms to State Implementation Plan If emissions are below “de minimis thresholds,” a full – general conformity determination is not required If a general conformity determination is required, must – revise the State Implementation Plan to accommodate emissions or purchase emissions credits 4 DRAFT Subject to Change 2
4/7/2017 - yxwvutsrponmljihgfedcbaYWTSRQPNMLIGFEDCBA Unmitigated Emissions (Daily) Alter Description PM10 native (lbs/day) 1 East Side Small Gated Notch 1,843 2 Central Small Gated Notch 3,361 3 West Side Small Gated Notch 3,365 4 Managed Flow 4,376 5 Multiple Gates 8,543 6 Large Gated Notch 4,024 YoloSolano AQMD CEQA Significance Thresholds 80 Feather River AQMD CEQA Significance 80 Thresholds 5 Unmitigated Emissions (Annual) Alt ROG NOx PM10 (tons/yr) (tons/yr) (tons/yr) 1 1.2 16.1 23.7 2 1.7 24.3 48.2 3 2.2 31.0 72.7 4 3.7 57.9 93.2 5 6.0 71.1 333.2 6 3.9 61.1 149.6 YoloSolano AQMD 10 10 n/a Feather River AQMD 2.5 2.5 n/a Feather River AQMD 3.6 3.6 n/a (Alt 5) General Conformity 25 25 100 6 DRAFT Subject to Change 3
4/7/2017 Air Quality Mitigation • Reduce emissions by using Tier 4 construction equipment instead of the fleet average for Merced County • Pave roads used to remove spoil materials 7 - yxwvutsrponmljihgfedcbaYWTSRQPNMLIGFEDCBA Mitigated Emissions (Daily) Alter Description PM10 Mitigated native (lbs/day) PM10 (lbs/day) 1 East Side Small Gated Notch 1,843 170 2 Central Small Gated Notch 3,361 315 3 West Side Small Gated Notch 3,365 318 4 Managed Flow 4,376 450 5 Multiple Gates 8,543 823 6 Large Gated Notch 4,024 382 YoloSolano AQMD CEQA Significance 80 80 Thresholds Feather River AQMD CEQA Significance 80 80 Thresholds 8 DRAFT Subject to Change 4
4/7/2017 Mitigated Emissions (Annual) Alt ROG NOx PM10 Mitigated Mitigated Mitigated (tons/yr) (tons/yr) (tons/yr) ROG NOx PM10 1 1.2 16.1 23.7 0.8 10.3 2.6 2 1.7 24.3 48.2 1.1 15.2 5.2 3 2.2 31.0 72.7 1.4 18.8 7.7 4 3.7 57.9 93.2 2.5 38.8 10.9 5 6.0 71.1 333.2 3.3 28.0 33.3 6 3.9 61.1 149.6 2.3 37.7 15.6 Yolo 10 10 n/a 10 10 n/a Solano Feather 2.5 2.5 n/a 2.5 2.5 n/a Feather 3.6 3.6 n/a 3.6 3.6 n/a (Alt 5) Conformity 25 25 100 25 25 100 9 yxwvutsrponmljihgfedcbaYWTSRQPNMLIGFEDCBA Air Quality Options • Extend schedules for Alternative 4, 5, and 6 • Trade-offs because longer schedules extend biological impacts and delay fisheries benefits 10 DRAFT Subject to Change 5
Recommend
More recommend