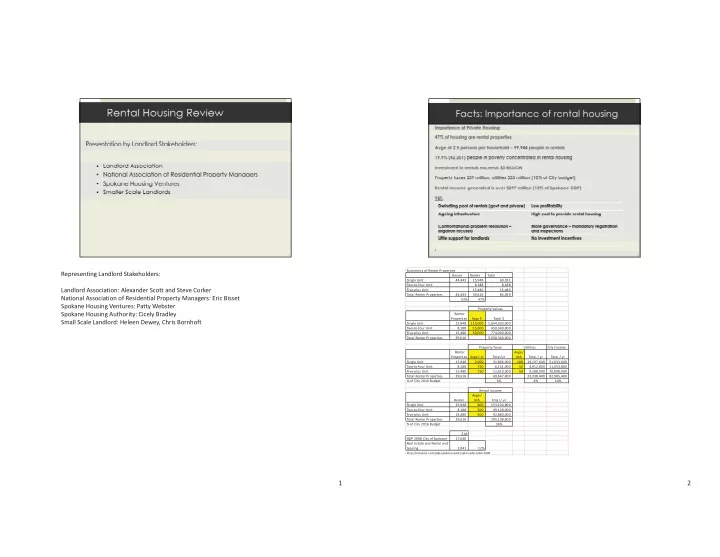

Economics�of�Renter�Properties Representing�Landlord�Stakeholders: Owner Renter Total Single�Unit ����� 44,443 ���� 15,948 ��������������� 60,391 Two�to�four�Unit ������ 8,188 ������������������ 8,188 Landlord�Association:�Alexander�Scott�and�Steve�Corker Five�plus�Unit ���� 15,480 ��������������� 15,480 Total�Renter�Properties ����� 44,443 ���� 39,616 ��������������� 84,059 National�Association�of�Residential�Property�Managers:�Eric�Bisset 53% 47% Spokane�Housing�Ventures:�Patty�Webster Property�Values Spokane�Housing�Authority:�Cicely�Bradley �Renter� Properties� Avge�$ Total�$ Small�Scale�Landlord:�Heleen Dewey,�Chris�Bornhoft Single�Unit ����� 15,948 115,000 � �� 1,834,020,000 Two�to�four�Unit ������� 8,188 ���� 55,000 ����� 450,340,000 Five�plus�Unit ����� 15,480 ���� 50,000 ����� 774,000,000 Total�Renter�Properties ����� 39,616 �� 3,058,360,000 Property�Taxes Utilities City�Income �Renter� Avge�/� Properties� �Avge�/�yr� Total/yr mth� Total�/�yr Total�/�yr Single�Unit ����� 15,948 ������ 2,000 ������� 31,896,000 ���� 100 19,137,600 � � 51,033,600 Two�to�four�Unit ������� 8,188 ��������� 750 ���������� 6,141,000 ������ 50 ���� 4,912,800 � 11,053,800 Five�plus�Unit ����� 15,480 ��������� 750 ������� 11,610,000 ������ 50 ���� 9,288,000 � 20,898,000 Total�Renter�Properties ����� 39,616 ������� 49,647,000 33,338,400 � � 82,985,400 %�of�City�2016�Budget 6% 4% 10% Rental�income �Avge�/� Renter mth� Total�/�yr Single�Unit ����� 15,948 ��������� 800 ����� 153,100,800 Two�to�four�Unit ������� 8,188 ��������� 500 ������� 49,128,000 Five�plus�Unit ����� 15,480 ��������� 500 ������� 92,880,000 Total�Renter�Properties ����� 39,616 ����� 295,108,800 %�of�City�2016�Budget 36% $�M GDP�2008�City�of�Spokane ����� 17,640 Real�Estate�and�Rental�and� Leasing ������� 2,041 12% http://econpost.com/gdp/spokane�washington�gdp�table�2008 1 2
Why�do�landlords�invest�in�residential�property? Capital�appreciation�– long�term,�repurpose�property Got�the�property�cheap�– e.g.�inheritance,�foreclosure Alternative�investment�at�stage�of�life Alternative�investment�compared�to�economic�conditions Increase�profit�by�better�Management�: Increase rent over time Increase�rent�over�time Increase�rent�– better�property�condition Reduce�Vacancies Good�tenants�– pay�rent�on�time,�take�care�of�property,�no�damage Reduce�costs�by�not�repairing�short�term Reduce�costs��by�not�doing�long�term�replacements Operate�and�sell�before�major�improvements�are�required 3 4
5 6
Population�Demographics . Age�of�Rental�Properties Spokane� City�of� Renter Pct. Population County Spokane 1930�and�prior ����� 10,696 27% 1931�to�1960 ����� 12,677 32% Persons�below�poverty�line ��� 76,910 �� 42,201 1961�to�1990 ������� 5,546 14% Est:�Households�below�poverty�line ��� 30,764 �� 17,584 1991�to�Current ����� 10,696 27% ����� 39,616 100% Est:�%�of�rental�units�occupied�by� households under poverty line households�under�poverty�line 44% 44% Age�of�Renter�Propeties A f R P i Population ��484,318� �212,067� 1930�and� Per�capita�income ���� 26,235 ��� 24,848 1991�to� prior,��10,696� Current,�� ,�27% Median�household�income ���� 50,249 ��� 43,694 10,696�,�27% Household�income�under�$50k $ 50.0% 55.0% Persons�below�poverty�line�% 16.4% 19.9% Poverty�Children�(under�18) 20.0% 25.0% 1931�to� 1961�to� 1960,��12,677� 1990,��5,546�,� Poverty�Seniors�(65�and�over) 9.0% 12.0% ,�32% 14% Number�of�households 187,603 � ��� 85,300 Persons�per�household 2.5 2.4 Number�of�housing�Units � 206,106 ��� 95,947 Source:�https://censusreporter.org/profiles/16000US5367000�spokane 7 8
Investment�in�Residential�rentals�is�ECOMONIC�driven: 9 10
11 12
13 14
15 16
Recommend
More recommend